Regions Bank 2010 Annual Report Download - page 77
Download and view the complete annual report
Please find page 77 of the 2010 Regions Bank annual report below. You can navigate through the pages in the report by either clicking on the pages listed below, or by using the keyword search tool below to find specific information within the annual report.-
 1
1 -
2
-
3
-
4
-
5
-
6
-
7
-
8
-
9
-
10
-
11
-
12
-
13
-
14
-
15
-
16
-
17
-
18
-
19
-
20
-
21
-
22
-
23
-
24
-
25
-
26
-
27
-
28
-
29
-
30
-
31
-
32
-
33
-
34
-
35
-
36
-
37
-
38
-
39
-
40
-
41
-
42
-
43
-
44
-
45
-
46
-
47
-
48
-
49
-
50
-
51
-
52
-
53
-
54
-
55
-
56
-
57
-
58
-
59
-
60
-
61
-
62
-
63
-
64
-
65
-
66
-
 67
67 -
 68
68 -
 69
69 -
 70
70 -
 71
71 -
 72
72 -
 73
73 -
 74
74 -
 75
75 -
 76
76 -
 77
77 -
 78
78 -
 79
79 -
 80
80 -
 81
81 -
 82
82 -
 83
83 -
 84
84 -
 85
85 -
 86
86 -
 87
87 -
88
-
89
-
90
-
91
-
92
-
93
-
94
-
95
-
96
-
97
-
98
-
99
-
100
-
101
-
102
-
103
-
104
-
105
-
106
-
107
-
108
-
109
-
110
-
111
-
112
-
113
-
114
-
115
-
116
-
117
-
118
-
119
-
120
-
121
-
122
-
123
-
124
-
125
-
126
-
127
-
128
-
129
-
130
-
131
-
132
-
133
-
134
-
135
-
136
-
137
-
138
-
139
-
140
-
141
-
142
-
143
-
144
-
145
-
146
-
147
-
148
-
149
-
150
-
151
-
152
-
153
-
154
-
155
-
156
-
157
-
158
-
159
-
160
-
161
-
162
-
163
-
164
-
165
-
166
-
167
-
168
-
169
-
170
-
171
-
172
-
173
-
174
-
175
-
176
-
177
-
178
-
179
-
180
-
181
-
182
-
183
-
184
-
185
-
186
-
187
-
188
-
189
-
190
-
191
-
192
-
193
-
194
-
195
-
196
-
197
-
198
-
199
-
200
-
201
-
202
-
203
-
204
-
205
-
206
-
207
-
208
-
209
-
210
-
211
-
212
-
213
-
214
-
215
-
216
-
217
-
218
-
219
-
220
-
221
-
222
-
223
-
224
-
225
-
226
-
227
-
228
-
229
-
230
-
231
-
232
-
233
-
234
-
235
-
236
 |
 |

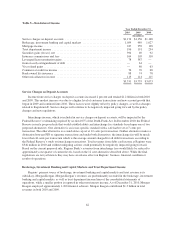
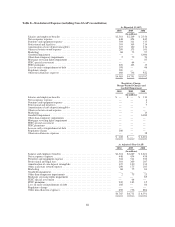
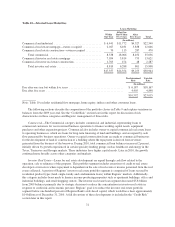
Total brokerage, investment banking and capital markets revenues increased 7 percent to $1.1 billion in
2010 from $989 million in 2009, primarily due to an increase in the investment banking and private client
brokerage services divisions. Results for 2010 reflect strength in these divisions, which is due in part to strategic
acquisitions that were made in specialized industries in recent years. Customer and trust assets under
management were approximately $80.0 billion and $77.0 billion, respectively, at year-end 2010 compared to
approximately $75.5 billion and $70.0 billion, respectively, at year-end 2009. The rise in assets under
management is primarily driven by a higher amount of asset inflows and higher end-of-period asset valuations
than in the prior year.
Revenues from the private client division increased 15 percent to $476 million, and accounted for 36 percent
of Morgan Keegan’s total revenue in 2010, compared to $415 million or 32 percent in 2009. Fixed-income
capital markets revenues decreased $38 million to $322 million, as compared to $360 million in 2009, although
revenues remained higher than in previous years, driven by institutional customers’ demand for government,
mortgage-backed and municipal securities. Equity capital markets revenue was negatively impacted by the
financial turmoil beginning in late 2008 and continuing through 2010. Equity capital markets revenues totaled
$55 million in 2010, compared to $59 million in 2009. Investment banking revenues increased $47 million to
$151 million as the division had success within its specialized industries, such as oil and gas, healthcare and
technology. Trust revenues increased 7 percent to $211 million in 2010, impacted by higher average asset
valuations. The asset management division produced $15 million of revenue in 2010 compared to $39 million in
2009, pressured by a lower amount of fees from commissions.
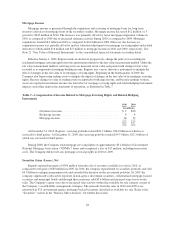
Morgan Keegan’s net income was negatively affected during 2010 by a $200 million regulatory charge
related to certain funds previously administered by Morgan Keegan and Morgan Asset Management. This charge
is nondeductible for income tax purposes. See Note 23 “Commitments, Contingencies and Guarantees” to the
consolidated financial statements for further information.
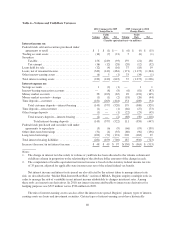
See Note 22 “Business Segment Information” for details of net income contributed by Morgan Keegan for
the years ended December 31, 2010, 2009 and 2008 and Table 6 “Morgan Keegan Revenue by Division” which
illustrates Morgan Keegan’s revenues by division for the years ended December 31, 2010, 2009 and 2008.
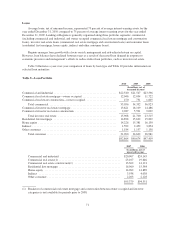
Table 6—Morgan Keegan Revenue by Division
Year Ended December 31
Private
Client
Fixed-Income
Capital
Markets
Equity
Capital
Markets
Investment
Banking
Regions
MK Trust
Asset
Management
Interest
and Other Total
(Dollars in millions)
2010
Gross revenue ......... $476 $322 $55 $151 $211 $15 $ 89 $1,319
Percent of gross
revenue ............ 36.1% 24.4% 4.2% 11.4% 16.0% 1.1% 6.8%
2009
Gross revenue ......... $415 $360 $59 $104 $197 $39 $108 $1,282
Percent of gross
revenue ............ 32.4% 28.1% 4.6% 8.1% 15.4% 3.0% 8.4%
2008
Gross revenue ......... $440 $266 $58 $158 $270 $31 $117 $1,340
Percent of gross
revenue ............ 32.8% 19.9% 4.3% 11.8% 20.2% 2.3% 8.7%
63