Regions Bank 2010 Annual Report Download - page 111
Download and view the complete annual report
Please find page 111 of the 2010 Regions Bank annual report below. You can navigate through the pages in the report by either clicking on the pages listed below, or by using the keyword search tool below to find specific information within the annual report.-
 1
1 -
2
-
3
-
4
-
5
-
6
-
7
-
8
-
9
-
10
-
11
-
12
-
13
-
14
-
15
-
16
-
17
-
18
-
19
-
20
-
21
-
22
-
23
-
24
-
25
-
26
-
27
-
28
-
29
-
30
-
31
-
32
-
33
-
34
-
35
-
36
-
37
-
38
-
39
-
40
-
41
-
42
-
43
-
44
-
45
-
46
-
47
-
48
-
49
-
50
-
51
-
52
-
53
-
54
-
55
-
56
-
57
-
58
-
59
-
60
-
61
-
62
-
63
-
64
-
65
-
66
-
67
-
68
-
69
-
70
-
71
-
72
-
73
-
74
-
75
-
76
-
77
-
78
-
79
-
80
-
81
-
82
-
83
-
84
-
85
-
86
-
87
-
88
-
89
-
90
-
91
-
92
-
93
-
94
-
95
-
96
-
97
-
98
-
99
-
100
-
 101
101 -
 102
102 -
 103
103 -
 104
104 -
 105
105 -
 106
106 -
 107
107 -
 108
108 -
 109
109 -
 110
110 -
 111
111 -
 112
112 -
 113
113 -
 114
114 -
 115
115 -
 116
116 -
 117
117 -
 118
118 -
 119
119 -
 120
120 -
 121
121 -
122
-
123
-
124
-
125
-
126
-
127
-
128
-
129
-
130
-
131
-
132
-
133
-
134
-
135
-
136
-
137
-
138
-
139
-
140
-
141
-
142
-
143
-
144
-
145
-
146
-
147
-
148
-
149
-
150
-
151
-
152
-
153
-
154
-
155
-
156
-
157
-
158
-
159
-
160
-
161
-
162
-
163
-
164
-
165
-
166
-
167
-
168
-
169
-
170
-
171
-
172
-
173
-
174
-
175
-
176
-
177
-
178
-
179
-
180
-
181
-
182
-
183
-
184
-
185
-
186
-
187
-
188
-
189
-
190
-
191
-
192
-
193
-
194
-
195
-
196
-
197
-
198
-
199
-
200
-
201
-
202
-
203
-
204
-
205
-
206
-
207
-
208
-
209
-
210
-
211
-
212
-
213
-
214
-
215
-
216
-
217
-
218
-
219
-
220
-
221
-
222
-
223
-
224
-
225
-
226
-
227
-
228
-
229
-
230
-
231
-
232
-
233
-
234
-
235
-
236
 |
 |

secured with the assets of the company and/or the personal guarantee of the business owners. Also considered as
commercial loans are owner-occupied commercial real estate loans to businesses for long-term financing of land
and buildings. Regions attempts to minimize risk on owner-occupied properties by requiring collateral values
that exceed the loan amount, adequate cash flow to service the debt, and, in many cases, the personal guarantees
of principals of the borrowers. Net charge-offs on commercial loans were 1.87 percent in 2010 compared to 1.28
percent in 2009.
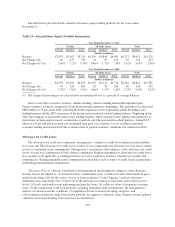
Investor Real Estate—The investor real estate portfolio segment totaled $15.9 billion at year-end 2010 and
includes various loan types. A large component of investor real estate loans is extensions of credit to real estate
developers and investors for the financing of land or buildings, where the repayment is generated from the sale of
the real estate or income generated by the real estate property. Net charge-offs on commercial investor real estate
mortgage loans continued to trend upward, from 3.64 percent in 2009 to 5.66 percent in 2010 reflecting
continued credit pressure. Commercial investor real estate construction loans are primarily extensions of credit to
real estate developers or investors where repayment is dependent on the sale of real estate or income generated
from the real estate collateral. These loans are generally underwritten and managed by a specialized real estate
group that also manages loan disbursements during the construction process. Net charge-offs on commercial
investor real estate construction loans rose substantially, from 6.66 percent in 2009 to 14.3 percent in 2010.
Losses on sales or transfers to held for sale of non-performing investor real estate loans also contributed to the
year-over-year increase in net charge-offs.
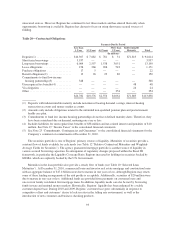
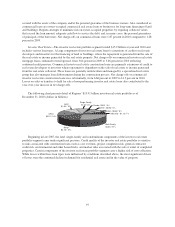
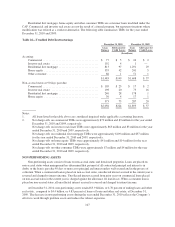
The following chart presents detail of Regions’ $15.91 billion investor real estate portfolio as of
December 31, 2010 (dollars in billions):
Other - $0.93 / 6%
Hotel - $0.82 / 5%
Industrial - $1.12 / 7%
Land
$1.64 / 10%
Office
$2.51 / 16%
Retail
$3.10 / 19%
Multi Family
$4.24 / 27%
Single Family
$1.24 / 8% Condo - $0.31 / 2%
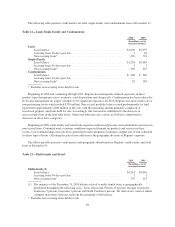
Beginning in late 2007, the land, single-family and condominium components of the investor real estate
portfolio segment came under significant pressure. Credit quality of the investor real estate portfolio is sensitive
to risks associated with construction loans such as cost overruns, project completion risk, general contractor
credit risk, environmental and other hazard risks, and market risks associated with the sale or rental of completed
properties. Certain components of the investor real estate portfolio segment carry a higher risk of non-collection.
While losses within these loan types were influenced by conditions described above, the most significant drivers
of losses were the continued decline in demand for residential real estate and in the value of property.
97