Regions Bank 2010 Annual Report Download - page 125
Download and view the complete annual report
Please find page 125 of the 2010 Regions Bank annual report below. You can navigate through the pages in the report by either clicking on the pages listed below, or by using the keyword search tool below to find specific information within the annual report.-
 1
1 -
2
-
3
-
4
-
5
-
6
-
7
-
8
-
9
-
10
-
11
-
12
-
13
-
14
-
15
-
16
-
17
-
18
-
19
-
20
-
21
-
22
-
23
-
24
-
25
-
26
-
27
-
28
-
29
-
30
-
31
-
32
-
33
-
34
-
35
-
36
-
37
-
38
-
39
-
40
-
41
-
42
-
43
-
44
-
45
-
46
-
47
-
48
-
49
-
50
-
51
-
52
-
53
-
54
-
55
-
56
-
57
-
58
-
59
-
60
-
61
-
62
-
63
-
64
-
65
-
66
-
67
-
68
-
69
-
70
-
71
-
72
-
73
-
74
-
75
-
76
-
77
-
78
-
79
-
80
-
81
-
82
-
83
-
84
-
85
-
86
-
87
-
88
-
89
-
90
-
91
-
92
-
93
-
94
-
95
-
96
-
97
-
98
-
99
-
100
-
101
-
102
-
103
-
104
-
105
-
106
-
107
-
108
-
109
-
110
-
111
-
112
-
113
-
114
-
 115
115 -
 116
116 -
 117
117 -
 118
118 -
 119
119 -
 120
120 -
 121
121 -
 122
122 -
 123
123 -
 124
124 -
 125
125 -
 126
126 -
 127
127 -
 128
128 -
 129
129 -
 130
130 -
 131
131 -
 132
132 -
 133
133 -
 134
134 -
 135
135 -
136
-
137
-
138
-
139
-
140
-
141
-
142
-
143
-
144
-
145
-
146
-
147
-
148
-
149
-
150
-
151
-
152
-
153
-
154
-
155
-
156
-
157
-
158
-
159
-
160
-
161
-
162
-
163
-
164
-
165
-
166
-
167
-
168
-
169
-
170
-
171
-
172
-
173
-
174
-
175
-
176
-
177
-
178
-
179
-
180
-
181
-
182
-
183
-
184
-
185
-
186
-
187
-
188
-
189
-
190
-
191
-
192
-
193
-
194
-
195
-
196
-
197
-
198
-
199
-
200
-
201
-
202
-
203
-
204
-
205
-
206
-
207
-
208
-
209
-
210
-
211
-
212
-
213
-
214
-
215
-
216
-
217
-
218
-
219
-
220
-
221
-
222
-
223
-
224
-
225
-
226
-
227
-
228
-
229
-
230
-
231
-
232
-
233
-
234
-
235
-
236
 |
 |
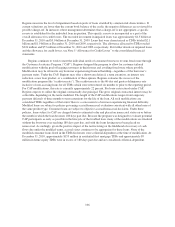
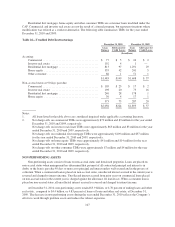
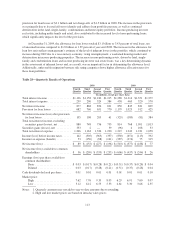
income was primarily due to revenue generated from unwinding certain leveraged lease transactions during the
year. However, this revenue was more than offset by the related income tax expense, resulting in an insignificant
aggregate impact to net income. Excluding the leveraged lease terminations, results reflected an increase in
mortgage income, primarily due to customers taking advantage of historically low mortgage rates, which drove
higher mortgage originations and slightly higher service charges income. In addition, non-interest income was
aided by a gain on the early extinguishment of debt realized in connection with the Company’s issuance of
common stock in exchange for trust preferred securities.
Offsetting the non-interest income increases, brokerage, investment banking and capital markets revenue
decreased in 2009 to $989 million compared to $1.0 billion in 2008 due to lower fees from investment banking
and capital markets. In addition, trust income fees were negatively impacted by lower asset valuations due to the
disarray in the markets during the year. Non-interest income (excluding securities transactions and leveraged
lease gains) as a percent of total revenue (on a fully taxable-equivalent basis) equaled 44 percent in 2009
compared to 43 percent in 2008. The increase is primarily due to higher mortgage income and a decline in net
interest income in 2009.
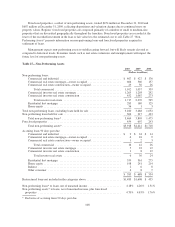
Service charges on deposit accounts increased 1 percent to $1.2 billion in 2009 from $1.1 billion in 2008.
This modest increase was the result of an increase in interchange income due to higher volumes, partially offset
by a decline in overdraft and insufficient funds revenues. Total revenues from overdrafts and insufficient funds
charges were $605 million in 2009 and $622 million in 2008.
In 2009, mortgage income increased $121 million, or 88 percent to $259 million. The increase was due to
increased refinance activity as customers took advantage of historically low mortgage rates, resulting in $9.6
billion in mortgage originations during the year, compared to $5.4 billion in 2008. Market valuation adjustments
for mortgage servicing rights and related derivatives added $13 million to mortgage income in 2009. No such
income was recorded in the previous year.
Regions reported net gains of $69 million from the sale of securities available for sale in 2009, compared to
net gains of $92 million in 2008. During 2009, the company significantly reduced its exposure in non-agency
investment securities, collateralized mortgage-backed securities and municipal securities and through these
measures incurred some losses on the sales. The Company’s gains were due to increased sales activity within the
available for sale category as part of the Company’s asset/liability management strategies. The proceeds from the
sales in 2009 and 2008 were reinvested in U.S. government agency mortgage-backed securities classified as
available for sale.
Total non-interest expense for 2008 included a $6 billion non-cash goodwill impairment charge and $201
million in merger-related charges. Non-interest expense was $4.8 billion in 2009, reflecting higher securities
impairments and FDIC insurance costs.
Salaries and employee benefits decreased 4 percent to $2.3 billion in 2009 compared to $2.4 billion in 2008,
Included in total salaries and employee benefits in 2008 are merger charges totaling $134 million. The year-over-
year decrease in salaries and employee benefits cost is the due to a 7 percent decline in headcount. At
December 31, 2009, Regions had 28,509 employees compared to 30,784 at December 31, 2008.
Net occupancy expense increased 3 percent to $454 million in 2009, due primarily to charges associated
with the 2009 decision to consolidate 121 branches. Also, included in net occupancy expense in 2008 were
merger charges of $4 million, reflecting costs to vacate leases due to the merger.
Furniture and equipment expense decreased $24 million to $311 million in 2009. This decrease is primarily
due to lower depreciation; however 2009 branch consolidation charges of $7 million partially offset the
decreases. Included in furniture and equipment expense were merger charges of $5 million in 2008.
111