Regions Bank 2010 Annual Report Download - page 179
Download and view the complete annual report
Please find page 179 of the 2010 Regions Bank annual report below. You can navigate through the pages in the report by either clicking on the pages listed below, or by using the keyword search tool below to find specific information within the annual report.-
 1
1 -
2
-
3
-
4
-
5
-
6
-
7
-
8
-
9
-
10
-
11
-
12
-
13
-
14
-
15
-
16
-
17
-
18
-
19
-
20
-
21
-
22
-
23
-
24
-
25
-
26
-
27
-
28
-
29
-
30
-
31
-
32
-
33
-
34
-
35
-
36
-
37
-
38
-
39
-
40
-
41
-
42
-
43
-
44
-
45
-
46
-
47
-
48
-
49
-
50
-
51
-
52
-
53
-
54
-
55
-
56
-
57
-
58
-
59
-
60
-
61
-
62
-
63
-
64
-
65
-
66
-
67
-
68
-
69
-
70
-
71
-
72
-
73
-
74
-
75
-
76
-
77
-
78
-
79
-
80
-
81
-
82
-
83
-
84
-
85
-
86
-
87
-
88
-
89
-
90
-
91
-
92
-
93
-
94
-
95
-
96
-
97
-
98
-
99
-
100
-
101
-
102
-
103
-
104
-
105
-
106
-
107
-
108
-
109
-
110
-
111
-
112
-
113
-
114
-
115
-
116
-
117
-
118
-
119
-
120
-
121
-
122
-
123
-
124
-
125
-
126
-
127
-
128
-
129
-
130
-
131
-
132
-
133
-
134
-
135
-
136
-
137
-
138
-
139
-
140
-
141
-
142
-
143
-
144
-
145
-
146
-
147
-
148
-
149
-
150
-
151
-
152
-
153
-
154
-
155
-
156
-
157
-
158
-
159
-
160
-
161
-
162
-
163
-
164
-
165
-
166
-
167
-
168
-
 169
169 -
 170
170 -
 171
171 -
 172
172 -
 173
173 -
 174
174 -
 175
175 -
 176
176 -
 177
177 -
 178
178 -
 179
179 -
 180
180 -
 181
181 -
 182
182 -
 183
183 -
 184
184 -
 185
185 -
 186
186 -
 187
187 -
 188
188 -
 189
189 -
190
-
191
-
192
-
193
-
194
-
195
-
196
-
197
-
198
-
199
-
200
-
201
-
202
-
203
-
204
-
205
-
206
-
207
-
208
-
209
-
210
-
211
-
212
-
213
-
214
-
215
-
216
-
217
-
218
-
219
-
220
-
221
-
222
-
223
-
224
-
225
-
226
-
227
-
228
-
229
-
230
-
231
-
232
-
233
-
234
-
235
-
236
 |
 |

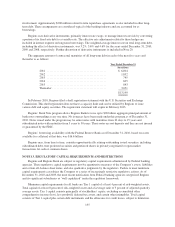
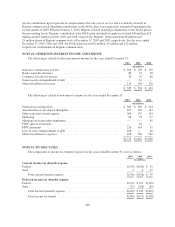
The settlement payments during 2010 and 2009 relate to the settlement of liabilities under the SERP for
certain executive officers.
The accumulated benefit obligation for all defined-benefit plans was $1.6 billion and $1.5 billion as of
December 31, 2010 and 2009, respectively, which exceeded all corresponding plan assets as of December 31,
2010 and 2009.
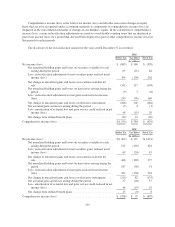
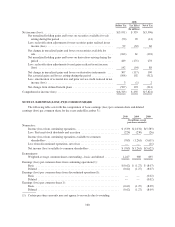
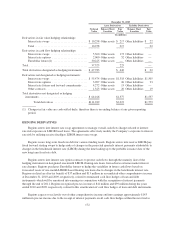
Net periodic benefit cost included the following components for the years ended December 31:
Pension
Other Postretirement
Benefits
2010 2009 2008 2010 2009 2008
(In millions)
Service cost ............................................ $ 36$3$51$— $— $1
Interest cost ............................................ 93 90 109 1 2 3
Expected return on plan assets ............................. (107) (88) (148) — — —
Amortization of actuarial loss ............................. 44 50 ————
Amortization of prior service cost (credit) .................... 1 1 3 (1) (1) (1)
Settlement charge ....................................... 3 1 ————
Curtailment gains ....................................... — — (3) — — —
Net periodic benefit cost .................................. $ 70 $ 57 $ 12 $— $1$3
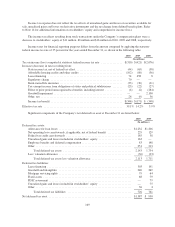
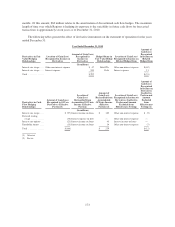
The estimated amounts that will be amortized from accumulated other comprehensive income (loss) into net
periodic benefit cost in 2011 are as follows:
Pension
Other
Postretirement Benefits
(In millions)
Actuarial loss (gain) ............................... $45 $—
Prior service cost (credit) ........................... 1 (1)
$46 $ (1)
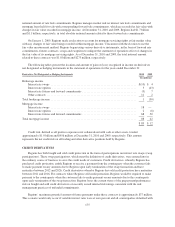
The weighted-average assumptions used to determine benefit obligations at December 31 are as follows:
Pension
Other
Postretirement Benefits
2010 2009 2010 2009
Discount rate ................................ 5.41% 6.02% 4.90% 5.35%
Rate of annual compensation increase ............ 3.76 5.00 N/A N/A
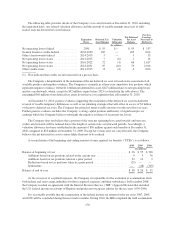
The weighted-average assumptions used to determine net periodic benefit cost for the years ended
December 31 are as follows:
Pension
Other Postretirement
Benefits
2010 2009 2008 2010 2009 2008
Discount rate ......................................... 6.02% 6.15% 6.38% 5.35% 6.20% 6.20%
Expected long-term rate of return on plan assets ............. 8.25 8.50 8.50 5.00 5.00 5.00
Rate of annual compensation increase ..................... 5.00 5.00 4.99 N/A N/A N/A
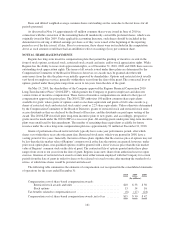
The expected long-term rate of return on plan assets is based on an estimated reasonable range of probable
returns. Management chose a point within the range based on the probability of achievement combined with
incremental returns attributable to active management.
The assumed health care cost trend rate for postretirement medical benefits was 6.8 percent for 2010 and is
assumed to decrease gradually to 4.5 percent by 2027 and remain at that level thereafter.
165