Regions Bank 2010 Annual Report Download - page 54
Download and view the complete annual report
Please find page 54 of the 2010 Regions Bank annual report below. You can navigate through the pages in the report by either clicking on the pages listed below, or by using the keyword search tool below to find specific information within the annual report.-
 1
1 -
2
-
3
-
4
-
5
-
6
-
7
-
8
-
9
-
10
-
11
-
12
-
13
-
14
-
15
-
16
-
17
-
18
-
19
-
20
-
21
-
22
-
23
-
24
-
25
-
26
-
27
-
28
-
29
-
30
-
31
-
32
-
33
-
34
-
35
-
36
-
37
-
38
-
39
-
40
-
41
-
42
-
43
-
 44
44 -
 45
45 -
 46
46 -
 47
47 -
 48
48 -
 49
49 -
 50
50 -
 51
51 -
 52
52 -
 53
53 -
 54
54 -
 55
55 -
 56
56 -
 57
57 -
 58
58 -
 59
59 -
 60
60 -
 61
61 -
 62
62 -
 63
63 -
 64
64 -
65
-
66
-
67
-
68
-
69
-
70
-
71
-
72
-
73
-
74
-
75
-
76
-
77
-
78
-
79
-
80
-
81
-
82
-
83
-
84
-
85
-
86
-
87
-
88
-
89
-
90
-
91
-
92
-
93
-
94
-
95
-
96
-
97
-
98
-
99
-
100
-
101
-
102
-
103
-
104
-
105
-
106
-
107
-
108
-
109
-
110
-
111
-
112
-
113
-
114
-
115
-
116
-
117
-
118
-
119
-
120
-
121
-
122
-
123
-
124
-
125
-
126
-
127
-
128
-
129
-
130
-
131
-
132
-
133
-
134
-
135
-
136
-
137
-
138
-
139
-
140
-
141
-
142
-
143
-
144
-
145
-
146
-
147
-
148
-
149
-
150
-
151
-
152
-
153
-
154
-
155
-
156
-
157
-
158
-
159
-
160
-
161
-
162
-
163
-
164
-
165
-
166
-
167
-
168
-
169
-
170
-
171
-
172
-
173
-
174
-
175
-
176
-
177
-
178
-
179
-
180
-
181
-
182
-
183
-
184
-
185
-
186
-
187
-
188
-
189
-
190
-
191
-
192
-
193
-
194
-
195
-
196
-
197
-
198
-
199
-
200
-
201
-
202
-
203
-
204
-
205
-
206
-
207
-
208
-
209
-
210
-
211
-
212
-
213
-
214
-
215
-
216
-
217
-
218
-
219
-
220
-
221
-
222
-
223
-
224
-
225
-
226
-
227
-
228
-
229
-
230
-
231
-
232
-
233
-
234
-
235
-
236
 |
 |
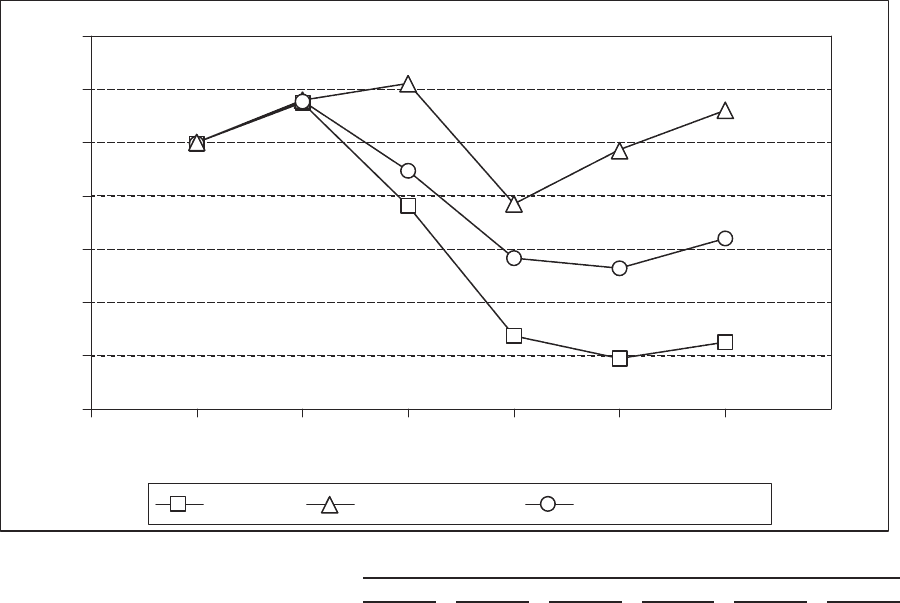
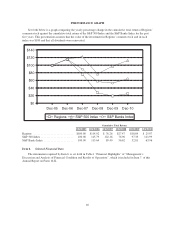
PERFORMANCE GRAPH
Set forth below is a graph comparing the yearly percentage change in the cumulative total return of Regions’
common stock against the cumulative total return of the S&P 500 Index and the S&P Banks Index for the past
five years. This presentation assumes that the value of the investment in Regions’ common stock and in each
index was $100 and that all dividends were reinvested.
$0
$20
$40
$60
$80
$100
$120
$140
Dec-05 Dec-06 Dec-07 Dec-08 Dec-09 Dec-10
Regions S&P 500 Index S&P Banks Index
Cumulative Total Return
12/31/2005 12/31/2006 12/31/2007 12/31/2008 12/31/2009 12/31/2010
Regions ............................ $100.00 $114.92 $ 76.26 $27.47 $18.84 $ 25.07
S&P 500 Index ....................... 100.00 115.79 122.16 76.96 97.33 111.99
S&P Banks Index ..................... 100.00 115.64 89.40 56.62 52.81 63.96
Item 6. Selected Financial Data
The information required by Item 6. is set forth in Table 1 “Financial Highlights” of “Management’s
Discussion and Analysis of Financial Condition and Results of Operations”, which is included in Item 7. of this
Annual Report on Form 10-K.
40