Regions Bank 2010 Annual Report Download - page 180
Download and view the complete annual report
Please find page 180 of the 2010 Regions Bank annual report below. You can navigate through the pages in the report by either clicking on the pages listed below, or by using the keyword search tool below to find specific information within the annual report.-
 1
1 -
2
-
3
-
4
-
5
-
6
-
7
-
8
-
9
-
10
-
11
-
12
-
13
-
14
-
15
-
16
-
17
-
18
-
19
-
20
-
21
-
22
-
23
-
24
-
25
-
26
-
27
-
28
-
29
-
30
-
31
-
32
-
33
-
34
-
35
-
36
-
37
-
38
-
39
-
40
-
41
-
42
-
43
-
44
-
45
-
46
-
47
-
48
-
49
-
50
-
51
-
52
-
53
-
54
-
55
-
56
-
57
-
58
-
59
-
60
-
61
-
62
-
63
-
64
-
65
-
66
-
67
-
68
-
69
-
70
-
71
-
72
-
73
-
74
-
75
-
76
-
77
-
78
-
79
-
80
-
81
-
82
-
83
-
84
-
85
-
86
-
87
-
88
-
89
-
90
-
91
-
92
-
93
-
94
-
95
-
96
-
97
-
98
-
99
-
100
-
101
-
102
-
103
-
104
-
105
-
106
-
107
-
108
-
109
-
110
-
111
-
112
-
113
-
114
-
115
-
116
-
117
-
118
-
119
-
120
-
121
-
122
-
123
-
124
-
125
-
126
-
127
-
128
-
129
-
130
-
131
-
132
-
133
-
134
-
135
-
136
-
137
-
138
-
139
-
140
-
141
-
142
-
143
-
144
-
145
-
146
-
147
-
148
-
149
-
150
-
151
-
152
-
153
-
154
-
155
-
156
-
157
-
158
-
159
-
160
-
161
-
162
-
163
-
164
-
165
-
166
-
167
-
168
-
169
-
 170
170 -
 171
171 -
 172
172 -
 173
173 -
 174
174 -
 175
175 -
 176
176 -
 177
177 -
 178
178 -
 179
179 -
 180
180 -
 181
181 -
 182
182 -
 183
183 -
 184
184 -
 185
185 -
 186
186 -
 187
187 -
 188
188 -
 189
189 -
 190
190 -
191
-
192
-
193
-
194
-
195
-
196
-
197
-
198
-
199
-
200
-
201
-
202
-
203
-
204
-
205
-
206
-
207
-
208
-
209
-
210
-
211
-
212
-
213
-
214
-
215
-
216
-
217
-
218
-
219
-
220
-
221
-
222
-
223
-
224
-
225
-
226
-
227
-
228
-
229
-
230
-
231
-
232
-
233
-
234
-
235
-
236
 |
 |

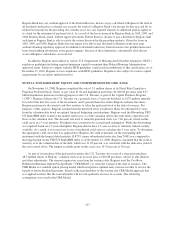
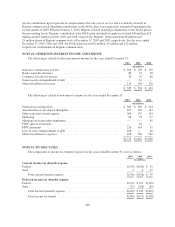
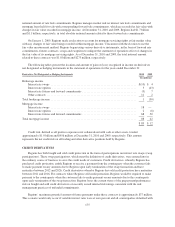
A one-percentage point change in assumed health care cost trend rates would have the following effects:
1-Percentage
Point Increase
1-Percentage
Point Decrease
(In thousands)
Effect on total of service cost and interest cost components ..... $ 44 $ (39)
Effect on postretirement benefit obligations ................. 943 (845)
The pension plan’s investment strategy is continuing to shift from focusing on maximizing asset returns to
minimizing funding ratio volatility, with an increase to the allocation to bonds. The target asset allocation is 43
percent equities, 32 percent fixed income securities and 25 percent in all other types of investments. Equity
securities include investments in large and small/mid cap companies primarily located in the United States as
well as investments in international equities. Fixed income securities include investments in corporate and
government bonds, asset-backed securities and any other fixed income investments as allowed by respective
prospectuses and other offering documents. Other types of investments may include hedge funds, real estate
funds, and private equity funds that follow several different strategies. Plan assets are highly diversified with
respect to asset class, security and manager. Investment risk is controlled with plan assets rebalancing to target
allocations on a periodic basis and continual monitoring of investment managers’ performance relative to the
investment guidelines established with each investment manager.
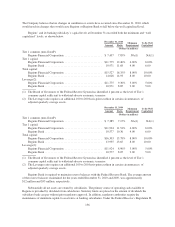
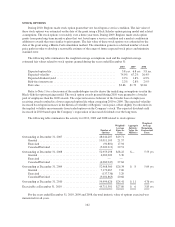
The Regions pension plan has a portion of its investments in Regions common stock. At December 31,
2010, the number of shares held by the plan was 2,855,618, which represents approximately 1.3 percent of the
plan assets for a total market value of approximately $20 million.
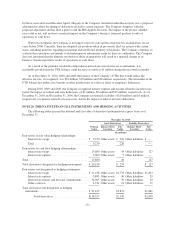
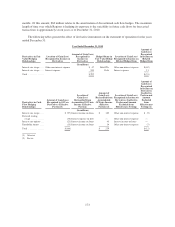
The following table presents the fair value of Regions’ defined-benefit pension plans’ and other
postretirement plans’ financial assets:
December 31, 2010
Level 1 Level 2 Level 3
Fair
Value
(In millions)
Cash and cash equivalents(1) ........................... $100 $— $— $ 100
Fixed income securities ............................... — 271 — 271
Common stock ...................................... 410 — — 410
Mutual funds ........................................ 368 — — 368
Collective investment trust funds ........................ 40 158 — 198
Hedge funds ........................................ — — 54 54
Real estate funds ..................................... — — 102 102
Miscellaneous assets .................................. — — 10 10
Total .................................................................. $1,513
(1) This amount includes the other postretirement plans’ financial assets of approximately $4 million.
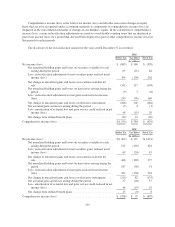
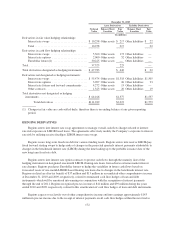
December 31, 2009
Level 1 Level 2 Level 3
Fair
Value
(In millions)
Cash and cash equivalents(1) ........................... $183 $— $— $ 183
Fixed income securities ............................... — 325 — 325
Common stock ...................................... 329 — — 329
Mutual funds ........................................ 309 — — 309
Hedge funds ........................................ — — 52 52
Real estate funds ..................................... — — 56 56
Miscellaneous assets .................................. — — 2 2
Total .................................................................. $1,256
(1) This amount includes the other postretirement plans’ financial assets of approximately $4 million.
166