Regions Bank 2010 Annual Report Download - page 72
Download and view the complete annual report
Please find page 72 of the 2010 Regions Bank annual report below. You can navigate through the pages in the report by either clicking on the pages listed below, or by using the keyword search tool below to find specific information within the annual report.-
 1
1 -
2
-
3
-
4
-
5
-
6
-
7
-
8
-
9
-
10
-
11
-
12
-
13
-
14
-
15
-
16
-
17
-
18
-
19
-
20
-
21
-
22
-
23
-
24
-
25
-
26
-
27
-
28
-
29
-
30
-
31
-
32
-
33
-
34
-
35
-
36
-
37
-
38
-
39
-
40
-
41
-
42
-
43
-
44
-
45
-
46
-
47
-
48
-
49
-
50
-
51
-
52
-
53
-
54
-
55
-
56
-
57
-
58
-
59
-
60
-
61
-
 62
62 -
 63
63 -
 64
64 -
 65
65 -
 66
66 -
 67
67 -
 68
68 -
 69
69 -
 70
70 -
 71
71 -
 72
72 -
 73
73 -
 74
74 -
 75
75 -
 76
76 -
 77
77 -
 78
78 -
 79
79 -
 80
80 -
 81
81 -
 82
82 -
83
-
84
-
85
-
86
-
87
-
88
-
89
-
90
-
91
-
92
-
93
-
94
-
95
-
96
-
97
-
98
-
99
-
100
-
101
-
102
-
103
-
104
-
105
-
106
-
107
-
108
-
109
-
110
-
111
-
112
-
113
-
114
-
115
-
116
-
117
-
118
-
119
-
120
-
121
-
122
-
123
-
124
-
125
-
126
-
127
-
128
-
129
-
130
-
131
-
132
-
133
-
134
-
135
-
136
-
137
-
138
-
139
-
140
-
141
-
142
-
143
-
144
-
145
-
146
-
147
-
148
-
149
-
150
-
151
-
152
-
153
-
154
-
155
-
156
-
157
-
158
-
159
-
160
-
161
-
162
-
163
-
164
-
165
-
166
-
167
-
168
-
169
-
170
-
171
-
172
-
173
-
174
-
175
-
176
-
177
-
178
-
179
-
180
-
181
-
182
-
183
-
184
-
185
-
186
-
187
-
188
-
189
-
190
-
191
-
192
-
193
-
194
-
195
-
196
-
197
-
198
-
199
-
200
-
201
-
202
-
203
-
204
-
205
-
206
-
207
-
208
-
209
-
210
-
211
-
212
-
213
-
214
-
215
-
216
-
217
-
218
-
219
-
220
-
221
-
222
-
223
-
224
-
225
-
226
-
227
-
228
-
229
-
230
-
231
-
232
-
233
-
234
-
235
-
236
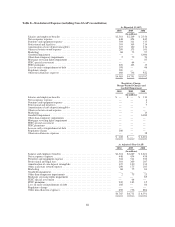
 |
 |
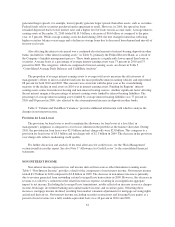
The Company is subject to income tax in the U.S. and multiple state and local jurisdictions. The tax laws
and regulations in each jurisdiction may be interpreted differently in certain situations, which could result in a
range of outcomes. Thus, the Company is required to exercise judgment regarding the application of these tax
laws and regulations. In the event a dispute with a taxing authority arises, the Company will evaluate and
recognize tax liabilities related to the tax uncertainties. Due to the complexity of some of these uncertainties, the
ultimate resolution may result in a payment that is different from the current estimate of the tax liabilities.
The Company’s estimate of accrued income taxes, deferred income taxes and income tax expense can also
change in any period as a result of new legislative or judicial guidance impacting tax positions, as well as
changes in income tax rates. Any changes, if they occur, can be significant to the Company’s financial position,
results of operations or cash flows.
OPERATING RESULTS
GENERAL
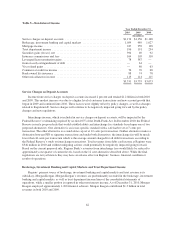
Regions reported a net loss available to common shareholders of $763 million in 2010, compared to a net
loss available to common shareholders of $1.3 billion in 2009. The lower loss in 2010 was primarily reflective of
moderation in credit quality within the Company’s loan portfolio. However, the provision for loan losses
remained elevated.
NET INTEREST INCOME AND MARGIN
Net interest income (interest income less interest expense) is Regions’ principal source of income and is one
of the most important elements of Regions’ ability to meet its overall performance goals. Net interest income on
a taxable-equivalent basis increased 3 percent to $3.5 billion in 2010 from $3.4 billion in 2009 despite a decrease
in the level of average earning assets, from $125.9 billion in 2009 to $119.3 billion in 2010. The increase in the
net interest margin to 2.90 percent in 2010 from 2.67 percent in 2009 was sufficient to offset the impact of the
smaller balance sheet size.
Comparing 2010 to 2009, interest-earning asset yields were lower, decreasing 30 basis points on average.
However, interest-bearing liability rates were also lower, declining by 60 basis points, which was more than
enough improvement in funding costs to offset the drop in interest-earning asset yields. As a result, the net
interest rate spread increased 30 basis points to 2.58 percent in 2010 as compared to 2.28 percent in 2009.
Continued low levels of long-term interest rates affected interest-earning asset yields through their influence on
the behavior and pricing of fixed-rate loans and securities. Longer-term rates remained at historical low levels and
fluctuated throughout the year. The yield on the benchmark 10-year U.S. Treasury note ranged from a high of 4.01
percent to a low of 2.41 percent, and for the year decreased 55 basis points, ending the year at 3.30 percent.
Persistently low long-term rates can incent fixed-rate borrowers to accelerate reductions or prepayments of existing
loans, often at lower rates of interest. This results in pressure on yields for portfolios that have a significant
concentration of fixed-rate loans. The taxable investment securities portfolio, which contains significant residential
fixed-rate exposure, for example, decreased in yield from 4.78 percent in 2009 to 3.66 percent in 2010.
The negative influence of low, long-term interest rates on net interest margin, however, was offset by
improvements in liability costs. The Federal Funds rate and the Prime Rate, which are influential drivers of loan
and deposit pricing on the shorter end of the yield curve, remained low at approximately 0.25 percent and 3.25
percent, respectively, throughout 2010, essentially unchanged from the previous year-end level. Despite the lack
of movement in short-term rates compared to historic lows, deposit costs improved considerably from 1.35
percent in 2009 to 0.78 percent in 2010. There was substantial improvement in costs in every deposit category,
including average money market accounts which declined from 0.84 percent to 0.43 percent, and yet experienced
an increase in average total balance from $21.4 billion in 2009 to $26.8 billion in 2010. The improvement in
overall deposit cost was also attributable to a less costly mix of deposits. For example, average time deposits
declined from $32.7 billion in 2009 to $26.2 billion in 2010. Meanwhile, average non-interest bearing customer
deposits increased from $20.7 billion in 2009 to $24.0 billion in 2010.
58