Regions Bank 2010 Annual Report Download - page 114
Download and view the complete annual report
Please find page 114 of the 2010 Regions Bank annual report below. You can navigate through the pages in the report by either clicking on the pages listed below, or by using the keyword search tool below to find specific information within the annual report.-
 1
1 -
2
-
3
-
4
-
5
-
6
-
7
-
8
-
9
-
10
-
11
-
12
-
13
-
14
-
15
-
16
-
17
-
18
-
19
-
20
-
21
-
22
-
23
-
24
-
25
-
26
-
27
-
28
-
29
-
30
-
31
-
32
-
33
-
34
-
35
-
36
-
37
-
38
-
39
-
40
-
41
-
42
-
43
-
44
-
45
-
46
-
47
-
48
-
49
-
50
-
51
-
52
-
53
-
54
-
55
-
56
-
57
-
58
-
59
-
60
-
61
-
62
-
63
-
64
-
65
-
66
-
67
-
68
-
69
-
70
-
71
-
72
-
73
-
74
-
75
-
76
-
77
-
78
-
79
-
80
-
81
-
82
-
83
-
84
-
85
-
86
-
87
-
88
-
89
-
90
-
91
-
92
-
93
-
94
-
95
-
96
-
97
-
98
-
99
-
100
-
101
-
102
-
103
-
 104
104 -
 105
105 -
 106
106 -
 107
107 -
 108
108 -
 109
109 -
 110
110 -
 111
111 -
 112
112 -
 113
113 -
 114
114 -
 115
115 -
 116
116 -
 117
117 -
 118
118 -
 119
119 -
 120
120 -
 121
121 -
 122
122 -
 123
123 -
 124
124 -
125
-
126
-
127
-
128
-
129
-
130
-
131
-
132
-
133
-
134
-
135
-
136
-
137
-
138
-
139
-
140
-
141
-
142
-
143
-
144
-
145
-
146
-
147
-
148
-
149
-
150
-
151
-
152
-
153
-
154
-
155
-
156
-
157
-
158
-
159
-
160
-
161
-
162
-
163
-
164
-
165
-
166
-
167
-
168
-
169
-
170
-
171
-
172
-
173
-
174
-
175
-
176
-
177
-
178
-
179
-
180
-
181
-
182
-
183
-
184
-
185
-
186
-
187
-
188
-
189
-
190
-
191
-
192
-
193
-
194
-
195
-
196
-
197
-
198
-
199
-
200
-
201
-
202
-
203
-
204
-
205
-
206
-
207
-
208
-
209
-
210
-
211
-
212
-
213
-
214
-
215
-
216
-
217
-
218
-
219
-
220
-
221
-
222
-
223
-
224
-
225
-
226
-
227
-
228
-
229
-
230
-
231
-
232
-
233
-
234
-
235
-
236
 |
 |

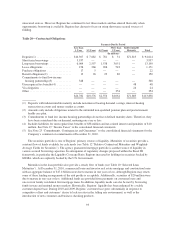
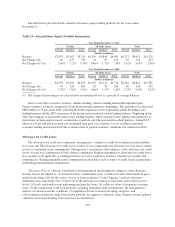
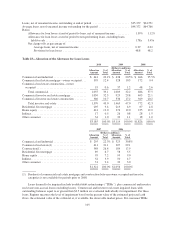
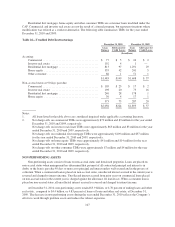
The table below provides details related to the home equity lending portfolio for the years ended
December 31:
Table 23—Selected Home Equity Portfolio Information
Year Ended December 31, 2010
Florida All Other States Total
1st Lien 2nd Lien Total 1st Lien 2nd Lien Total 1st Lien 2nd Lien Total
(Dollars in millions)
Balance .............. $2,074 $3,167 $5,241 $4,139 $4,846 $8,985 $6,213 $8,013 $14,226
Net Charge-offs ....... 56 237 293 34 87 121 90 324 414
Net Charge-off %(1) .... 2.66% 7.12% 5.38% 0.80% 1.71% 1.30% 1.42% 3.85% 2.80%
Year Ended December 31, 2009
Florida All Other States Total
1st Lien 2nd Lien Total 1st Lien 2nd Lien Total 1st Lien 2nd Lien Total
(Dollars in millions)
Balance .............. $2,170 $3,485 $5,655 $4,395 $5,331 $9,726 $6,565 $8,816 $15,381
Net Charge-offs ....... 59 250 309 30 76 106 89 326 415
Net Charge-off %(1) .... 2.75% 7.01% 5.41% 0.66% 1.37% 1.05% 1.33% 3.58% 2.63%
(1) Net charge-off percentages are calculated on an annualized basis as a percent of average balances.
Indirect and Other Consumer Lending—Indirect lending, which is lending initiated through third-party
business partners, is largely comprised of loans made through automotive dealerships. This portfolio class decreased
$860 million or 35 percent in 2010, reflecting the 2008 suspension of new originations within the indirect auto
lending business and the 2007 suspension of the marine and recreational vehicle lending business. Beginning in late
2010, the Company re-entered the indirect auto lending business. Other consumer loans, which consist primarily of
borrowings for home improvements, automobiles, overdrafts and other personal household purposes, totaled $1.2
billion as of year-end and were relatively unchanged from prior year’s balance. Losses on indirect and other
consumer lending increased in 2009 due to deterioration of general economic conditions, but stabilized in 2010.
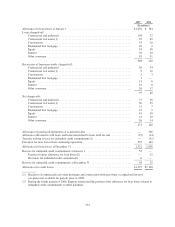
Allowance for Credit Losses
The allowance for credit losses represents management’s estimate of credit losses inherent in the portfolio
as of year-end. The allowance for credit losses consists of two components: the allowance for loan losses and the
reserve for unfunded credit commitments. Management’s assessment of the adequacy of the allowance for credit
losses is based on a combination of both of these components. Regions determines its allowance for credit losses
in accordance with applicable accounting literature as well as regulatory guidance related to receivables and
contingencies. Binding unfunded credit commitments include items such as letters of credit, financial guarantees
and binding unfunded loan commitments.
Allowance Process—Factors considered by management in determining the adequacy of the allowance
include, but are not limited to: (1) detailed reviews of individual loans; (2) historical and current trends in gross
and net loan charge-offs for the various classes of loans evaluated; (3) the Company’s policies relating to
delinquent loans and charge-offs; (4) the level of the allowance in relation to total loans and to historical loss
levels; (5) levels and trends in non-performing and past due loans; (6) collateral values of properties securing
loans; (7) the composition of the loan portfolio, including unfunded credit commitments; (8) management’s
analysis of current economic conditions; (9) migration of loans between risk rating categories; and
(10) estimation of inherent credit losses in the portfolio. In support of collateral values, Regions obtains updated
valuations for non-performing loans on at least an annual basis.
100