Regions Bank 2010 Annual Report Download - page 121
Download and view the complete annual report
Please find page 121 of the 2010 Regions Bank annual report below. You can navigate through the pages in the report by either clicking on the pages listed below, or by using the keyword search tool below to find specific information within the annual report.-
 1
1 -
2
-
3
-
4
-
5
-
6
-
7
-
8
-
9
-
10
-
11
-
12
-
13
-
14
-
15
-
16
-
17
-
18
-
19
-
20
-
21
-
22
-
23
-
24
-
25
-
26
-
27
-
28
-
29
-
30
-
31
-
32
-
33
-
34
-
35
-
36
-
37
-
38
-
39
-
40
-
41
-
42
-
43
-
44
-
45
-
46
-
47
-
48
-
49
-
50
-
51
-
52
-
53
-
54
-
55
-
56
-
57
-
58
-
59
-
60
-
61
-
62
-
63
-
64
-
65
-
66
-
67
-
68
-
69
-
70
-
71
-
72
-
73
-
74
-
75
-
76
-
77
-
78
-
79
-
80
-
81
-
82
-
83
-
84
-
85
-
86
-
87
-
88
-
89
-
90
-
91
-
92
-
93
-
94
-
95
-
96
-
97
-
98
-
99
-
100
-
101
-
102
-
103
-
104
-
105
-
106
-
107
-
108
-
109
-
110
-
 111
111 -
 112
112 -
 113
113 -
 114
114 -
 115
115 -
 116
116 -
 117
117 -
 118
118 -
 119
119 -
 120
120 -
 121
121 -
 122
122 -
 123
123 -
 124
124 -
 125
125 -
 126
126 -
 127
127 -
 128
128 -
 129
129 -
 130
130 -
 131
131 -
132
-
133
-
134
-
135
-
136
-
137
-
138
-
139
-
140
-
141
-
142
-
143
-
144
-
145
-
146
-
147
-
148
-
149
-
150
-
151
-
152
-
153
-
154
-
155
-
156
-
157
-
158
-
159
-
160
-
161
-
162
-
163
-
164
-
165
-
166
-
167
-
168
-
169
-
170
-
171
-
172
-
173
-
174
-
175
-
176
-
177
-
178
-
179
-
180
-
181
-
182
-
183
-
184
-
185
-
186
-
187
-
188
-
189
-
190
-
191
-
192
-
193
-
194
-
195
-
196
-
197
-
198
-
199
-
200
-
201
-
202
-
203
-
204
-
205
-
206
-
207
-
208
-
209
-
210
-
211
-
212
-
213
-
214
-
215
-
216
-
217
-
218
-
219
-
220
-
221
-
222
-
223
-
224
-
225
-
226
-
227
-
228
-
229
-
230
-
231
-
232
-
233
-
234
-
235
-
236
 |
 |

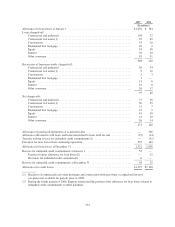
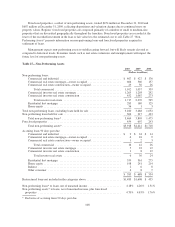
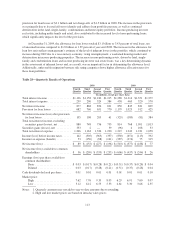
Residential first mortgage, home equity and other consumer TDRs are consumer loans modified under the
CAP. Commercial and investor real estate are not the result of a formal program, but represent situations where
modification was offered as a workout alternative. The following table summarizes TDRs for the years ended
December 31, 2010 and 2009:
Table 26—Troubled Debt Restructurings
December 31, 2010 December 31, 2009
Loan
Balance
Allowance for
Credit Losses
Loan
Balance
Allowance for
Credit Losses
(In millions)
Accruing:
Commercial ....................................... $ 77 $ 5 $ 24 $ 2
Investor real estate ................................. 192 4 1 —
Residential first mortgage ............................ 813 97 1,291 29
Home equity ...................................... 335 42 241 5
Other consumer .................................... 66 1 51 1
$1,483 $149 $1,608 $ 37
Non-accrual status or 90 days past due:
Commercial ....................................... $ 105 $ 23 $ 17 $ 2
Investor real estate ................................. 198 20 75 16
Residential first mortgage ............................ 240 28 178 1
Home equity ...................................... 30 4 17 1
573 75 287 20
$2,056 $224 $1,895 $ 57
Notes:
1. All loans listed in the table above are considered impaired under applicable accounting literature.
2. Net charge-offs on commercial TDRs were approximately $72 million and $9 million for the year ended
December 31, 2010 and 2009, respectively.
Net charge-offs on investor real estate TDRs were approximately $63 million and $3 million for the year
ended December 31, 2010 and 2009, respectively.
Net charge-offs on residential first mortgage TDRs were approximately $109 million and $57 million
for the year ended December 31, 2010 and 2009, respectively.
Net charge-offs on home equity TDRs were approximately $41 million and $14 million for the year
ended December 31, 2010 and 2009, respectively.
Net charge-offs on other consumer TDRs were approximately $7 million and $4 million for the year
ended December 31, 2010 and 2009, respectively.
NON-PERFORMING ASSETS
Non-performing assets consist of loans on non-accrual status and foreclosed properties. Loans are placed on
non-accrual status when management has determined that payment of all contractual principal and interest is in
doubt, or the loan is past due 90 days or more as to principal and interest unless well-secured and in the process of
collection. When a commercial loan is placed on non-accrual status, uncollected interest accrued in the current year is
reversed and charged to interest income. Uncollected interest accrued from prior years on commercial loans placed
on non-accrual status in the current year is charged against the allowance for loan losses. When a consumer loan is
placed on non-accrual status, all uncollected interest accrued is reversed and charged to interest income.
At December 31, 2010, non-performing assets totaled $3.9 billion, or 4.70 percent of ending loans and other
real estate , compared to $4.4 billion, or 4.83 percent of loans of loans and other real estate, at December 31,
2009. The decrease in non-performing assets during the year ended December 31, 2010 reflects the Company’s
efforts to work through problem assets and reduce the riskiest exposures.
107