Regions Bank 2010 Annual Report Download - page 137
Download and view the complete annual report
Please find page 137 of the 2010 Regions Bank annual report below. You can navigate through the pages in the report by either clicking on the pages listed below, or by using the keyword search tool below to find specific information within the annual report.-
 1
1 -
2
-
3
-
4
-
5
-
6
-
7
-
8
-
9
-
10
-
11
-
12
-
13
-
14
-
15
-
16
-
17
-
18
-
19
-
20
-
21
-
22
-
23
-
24
-
25
-
26
-
27
-
28
-
29
-
30
-
31
-
32
-
33
-
34
-
35
-
36
-
37
-
38
-
39
-
40
-
41
-
42
-
43
-
44
-
45
-
46
-
47
-
48
-
49
-
50
-
51
-
52
-
53
-
54
-
55
-
56
-
57
-
58
-
59
-
60
-
61
-
62
-
63
-
64
-
65
-
66
-
67
-
68
-
69
-
70
-
71
-
72
-
73
-
74
-
75
-
76
-
77
-
78
-
79
-
80
-
81
-
82
-
83
-
84
-
85
-
86
-
87
-
88
-
89
-
90
-
91
-
92
-
93
-
94
-
95
-
96
-
97
-
98
-
99
-
100
-
101
-
102
-
103
-
104
-
105
-
106
-
107
-
108
-
109
-
110
-
111
-
112
-
113
-
114
-
115
-
116
-
117
-
118
-
119
-
120
-
121
-
122
-
123
-
124
-
125
-
126
-
 127
127 -
 128
128 -
 129
129 -
 130
130 -
 131
131 -
 132
132 -
 133
133 -
 134
134 -
 135
135 -
 136
136 -
 137
137 -
 138
138 -
 139
139 -
 140
140 -
 141
141 -
 142
142 -
 143
143 -
 144
144 -
 145
145 -
 146
146 -
 147
147 -
148
-
149
-
150
-
151
-
152
-
153
-
154
-
155
-
156
-
157
-
158
-
159
-
160
-
161
-
162
-
163
-
164
-
165
-
166
-
167
-
168
-
169
-
170
-
171
-
172
-
173
-
174
-
175
-
176
-
177
-
178
-
179
-
180
-
181
-
182
-
183
-
184
-
185
-
186
-
187
-
188
-
189
-
190
-
191
-
192
-
193
-
194
-
195
-
196
-
197
-
198
-
199
-
200
-
201
-
202
-
203
-
204
-
205
-
206
-
207
-
208
-
209
-
210
-
211
-
212
-
213
-
214
-
215
-
216
-
217
-
218
-
219
-
220
-
221
-
222
-
223
-
224
-
225
-
226
-
227
-
228
-
229
-
230
-
231
-
232
-
233
-
234
-
235
-
236
 |
 |

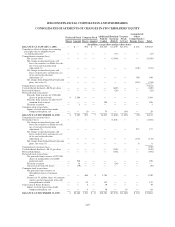
The following table summarizes supplemental cash flow information for the years ended December 31:
2010 2009 2008
(In millions)
Cash paid (received) during the period for:
Interest .......................................................... $1,442 $2,086 $2,800
Income taxes, net .................................................. (555) 137 267
Loans transferred to other real estate ....................................... 649 890 414
Student loans transferred to loans held for sale ............................... — — 792
Nonperforming loans transferred to loans held for sale ......................... 594 374 482
Properties transferred to held for sale ...................................... 6 68 —
SECURITIES PURCHASED UNDER AGREEMENTS TO RESELL AND SECURITIES SOLD UNDER
AGREEMENTS TO REPURCHASE
Securities purchased under agreements to resell and securities sold under agreements to repurchase are
treated as collateralized financing transactions. It is Regions’ policy to take possession of securities purchased
under resell agreements.
TRADING ACCOUNT ASSETS
Trading account assets, which are primarily held for the purpose of selling at a profit, consist of debt and
marketable equity securities and are carried at estimated fair value. Gains and losses, both realized and
unrealized, are included in brokerage, investment banking and capital markets income.
SECURITIES
Management determines the appropriate classification of debt and equity securities at the time of purchase
and periodically re-evaluates such designations. Debt securities are classified as securities held to maturity when
the Company has the intent and ability to hold the securities to maturity. Securities held to maturity are stated at
amortized cost. Debt securities not classified as securities held to maturity or trading account assets and
marketable equity securities not classified as trading account assets are classified as securities available for sale.
Securities available for sale are stated at estimated fair value with changes in unrealized gains and losses, net of
taxes, reported as a component of other comprehensive income (loss). See Note 21 for discussion of determining
fair value.
The amortized cost of debt securities classified as securities held to maturity and securities available for sale
is adjusted for amortization of premiums and accretion of discounts to maturity, or in the case of mortgage-
backed securities, over the estimated life of the security, using the effective yield method. Such amortization or
accretion is included in interest income on securities. Realized gains and losses are included in net securities
gains (losses). The cost of securities sold is based on the specific identification method.
The Company reviews its securities portfolio on a regular basis to determine if there are any conditions
indicating that a security has other-than-temporary impairment. Factors considered in this determination include
the length of time and the extent to which the market value has been below cost, the credit standing of the issuer,
Regions’ intent to sell and whether it is more likely than not that the Company will have to sell the security
before its market value recovers. Activity related to the credit loss component of other-than-temporary
impairment is recognized in earnings. For debt securities, the portion of other-than-temporary impairment related
to all factors other than credit is recognized in other comprehensive income. See Note 3 for discussion and details
of other-than-temporary impairment.
123