Regions Bank 2010 Annual Report Download - page 189
Download and view the complete annual report
Please find page 189 of the 2010 Regions Bank annual report below. You can navigate through the pages in the report by either clicking on the pages listed below, or by using the keyword search tool below to find specific information within the annual report.-
 1
1 -
2
-
3
-
4
-
5
-
6
-
7
-
8
-
9
-
10
-
11
-
12
-
13
-
14
-
15
-
16
-
17
-
18
-
19
-
20
-
21
-
22
-
23
-
24
-
25
-
26
-
27
-
28
-
29
-
30
-
31
-
32
-
33
-
34
-
35
-
36
-
37
-
38
-
39
-
40
-
41
-
42
-
43
-
44
-
45
-
46
-
47
-
48
-
49
-
50
-
51
-
52
-
53
-
54
-
55
-
56
-
57
-
58
-
59
-
60
-
61
-
62
-
63
-
64
-
65
-
66
-
67
-
68
-
69
-
70
-
71
-
72
-
73
-
74
-
75
-
76
-
77
-
78
-
79
-
80
-
81
-
82
-
83
-
84
-
85
-
86
-
87
-
88
-
89
-
90
-
91
-
92
-
93
-
94
-
95
-
96
-
97
-
98
-
99
-
100
-
101
-
102
-
103
-
104
-
105
-
106
-
107
-
108
-
109
-
110
-
111
-
112
-
113
-
114
-
115
-
116
-
117
-
118
-
119
-
120
-
121
-
122
-
123
-
124
-
125
-
126
-
127
-
128
-
129
-
130
-
131
-
132
-
133
-
134
-
135
-
136
-
137
-
138
-
139
-
140
-
141
-
142
-
143
-
144
-
145
-
146
-
147
-
148
-
149
-
150
-
151
-
152
-
153
-
154
-
155
-
156
-
157
-
158
-
159
-
160
-
161
-
162
-
163
-
164
-
165
-
166
-
167
-
168
-
169
-
170
-
171
-
172
-
173
-
174
-
175
-
176
-
177
-
178
-
 179
179 -
 180
180 -
 181
181 -
 182
182 -
 183
183 -
 184
184 -
 185
185 -
 186
186 -
 187
187 -
 188
188 -
 189
189 -
 190
190 -
 191
191 -
 192
192 -
 193
193 -
 194
194 -
 195
195 -
 196
196 -
 197
197 -
 198
198 -
 199
199 -
200
-
201
-
202
-
203
-
204
-
205
-
206
-
207
-
208
-
209
-
210
-
211
-
212
-
213
-
214
-
215
-
216
-
217
-
218
-
219
-
220
-
221
-
222
-
223
-
224
-
225
-
226
-
227
-
228
-
229
-
230
-
231
-
232
-
233
-
234
-
235
-
236
 |
 |

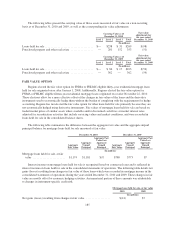
notional amount of rate lock commitments. Regions manages market risk on interest rate lock commitments and
mortgage loans held for sale with corresponding forward sale commitments, which are recorded at fair value with
changes in fair value recorded in mortgage income. At December 31, 2010 and 2009, Regions had $1.7 billion
and $1.1 billion, respectively, in total absolute notional amount related to these forward rate commitments.
On January 1, 2009, Regions made an election to account for mortgage servicing rights at fair market value
with any changes to fair value being recorded within mortgage income. Concurrent with the election to use the
fair value measurement method, Regions began using various derivative instruments, in the form of forward rate
commitments, futures contracts, swaps and swaptions to mitigate the statement of operations effect of changes in
the fair value of its mortgage servicing rights. As of December 31, 2010 and 2009, the total notional amount
related to these contracts was $1.8 billion and $275 million, respectively.
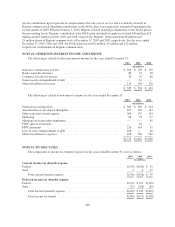
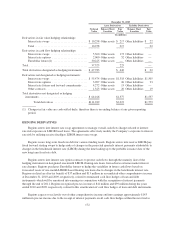
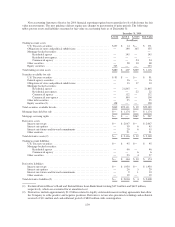
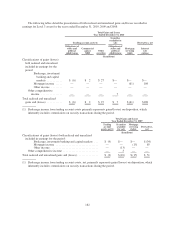
The following tables present the location and amount of gain or (loss) recognized in income on derivatives
not designated as hedging instruments in the statement of operations for the years ended December 31:
Derivatives Not Designated as Hedging Instruments 2010 2009
(In millions)
Brokerage income
Interest rate swaps ............................................................ $(10) $ 4
Interest rate options ........................................................... 3 (43)
Interest rate futures and forward commitments ...................................... (3) 7
Other contracts ............................................................... 11 2
Total brokerage income ............................................................ 1 (30)
Mortgage income
Interest rate swaps ............................................................ 18 —
Interest rate options ........................................................... 2 (8)
Interest rate futures and forward commitments ...................................... 68 50
Total mortgage income ............................................................ 88 42
$89 $ 12
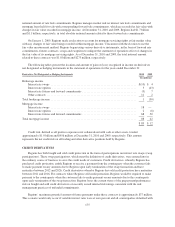
Credit risk, defined as all positive exposures not collateralized with cash or other assets, totaled
approximately $1.0 billion and $956 million at December 31, 2010 and 2009, respectively. This amount
represents the net credit risk on all trading and other derivative positions held by Regions.
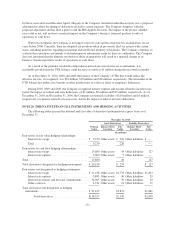
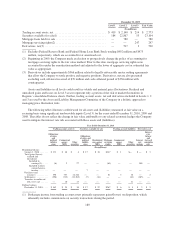
CREDIT DERIVATIVES
Regions has both bought and sold credit protection in the form of participations on interest rate swaps (swap
participations). These swap participations, which meet the definition of credit derivatives, were entered into in
the ordinary course of business to serve the credit needs of customers. Credit derivatives, whereby Regions has
purchased credit protection, entitle Regions to receive a payment from the counterparty when the customer fails
to make payment on any amounts due to Regions upon early termination of the swap transaction and have
maturities between 2012 and 2026. Credit derivatives whereby Regions has sold credit protection have maturities
between 2011 and 2016. For contracts where Regions sold credit protection, Regions would be required to make
payment to the counterparty when the customer fails to make payment on any amounts due to the counterparty
upon early termination of the swap transaction. Regions bases the current status of the prepayment/performance
risk on bought and sold credit derivatives on recently issued internal risk ratings consistent with the risk
management practices of unfunded commitments.
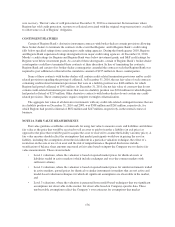
Regions’ maximum potential amount of future payments under these contracts is approximately $37 million.
This scenario would only occur if variable interest rates were at zero percent and all counterparties defaulted with
175