Regions Bank 2010 Annual Report Download - page 84
Download and view the complete annual report
Please find page 84 of the 2010 Regions Bank annual report below. You can navigate through the pages in the report by either clicking on the pages listed below, or by using the keyword search tool below to find specific information within the annual report.-
 1
1 -
2
-
3
-
4
-
5
-
6
-
7
-
8
-
9
-
10
-
11
-
12
-
13
-
14
-
15
-
16
-
17
-
18
-
19
-
20
-
21
-
22
-
23
-
24
-
25
-
26
-
27
-
28
-
29
-
30
-
31
-
32
-
33
-
34
-
35
-
36
-
37
-
38
-
39
-
40
-
41
-
42
-
43
-
44
-
45
-
46
-
47
-
48
-
49
-
50
-
51
-
52
-
53
-
54
-
55
-
56
-
57
-
58
-
59
-
60
-
61
-
62
-
63
-
64
-
65
-
66
-
67
-
68
-
69
-
70
-
71
-
72
-
73
-
 74
74 -
 75
75 -
 76
76 -
 77
77 -
 78
78 -
 79
79 -
 80
80 -
 81
81 -
 82
82 -
 83
83 -
 84
84 -
 85
85 -
 86
86 -
 87
87 -
 88
88 -
 89
89 -
 90
90 -
 91
91 -
 92
92 -
 93
93 -
 94
94 -
95
-
96
-
97
-
98
-
99
-
100
-
101
-
102
-
103
-
104
-
105
-
106
-
107
-
108
-
109
-
110
-
111
-
112
-
113
-
114
-
115
-
116
-
117
-
118
-
119
-
120
-
121
-
122
-
123
-
124
-
125
-
126
-
127
-
128
-
129
-
130
-
131
-
132
-
133
-
134
-
135
-
136
-
137
-
138
-
139
-
140
-
141
-
142
-
143
-
144
-
145
-
146
-
147
-
148
-
149
-
150
-
151
-
152
-
153
-
154
-
155
-
156
-
157
-
158
-
159
-
160
-
161
-
162
-
163
-
164
-
165
-
166
-
167
-
168
-
169
-
170
-
171
-
172
-
173
-
174
-
175
-
176
-
177
-
178
-
179
-
180
-
181
-
182
-
183
-
184
-
185
-
186
-
187
-
188
-
189
-
190
-
191
-
192
-
193
-
194
-
195
-
196
-
197
-
198
-
199
-
200
-
201
-
202
-
203
-
204
-
205
-
206
-
207
-
208
-
209
-
210
-
211
-
212
-
213
-
214
-
215
-
216
-
217
-
218
-
219
-
220
-
221
-
222
-
223
-
224
-
225
-
226
-
227
-
228
-
229
-
230
-
231
-
232
-
233
-
234
-
235
-
236
 |
 |
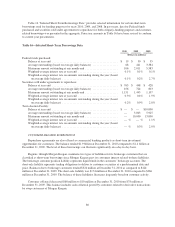
• Reversals of taxable temporary differences—The Company anticipates that future reversals of taxable
temporary differences, including the accretion of taxable temporary differences related to leveraged
leases acquired in the AmSouth merger, can absorb up to approximately $1.0 billion of deferred tax
assets.
• Creation of future taxable income—At December 31, 2010, the Company utilized all taxable income in
prior carryback years. The Company has projected future taxable income that will be sufficient to
absorb the remaining deferred tax assets after the reversal of future taxable temporary differences. The
taxable income forecasting process utilizes the forecasted pre-tax earnings and adjusts for book-tax
differences that will be exempt from taxation, primarily tax-exempt interest income and bank-owned
life insurance, as well as temporary book-tax differences including the allowance for loan losses. The
projections relied upon for this process are consistent with those used in the goodwill impairment test
and are sourced from the Company’s economic forecasting process.
• Strong capital position—At December 31, 2010, the Company had a Tier 1 capital ratio of 12.40
percent, substantially above the 6.0 percent minimum standard to be well capitalized. Also, the Total
capital ratio of 16.35 percent substantially exceeds the 10.0 percent minimum standard to be well
capitalized. The Company’s Tier 1 common ratio (non-GAAP) was 7.85 percent at December 31, 2010
(see Table 2 “GAAP to Non-GAAP Reconciliation” for further details). The Board of Governors of the
Federal Reserve System has identified 4 percent as the level of Tier 1 common capital sufficient to
withstand adverse economic scenarios.
• Ability to implement tax-planning strategies—The Company has the ability to implement tax planning
strategies to maximize the realization of deferred tax assets, such as the sale of appreciated assets. As
an example, during 2010, the Company reported net pre-tax gains of $394 million from the sale of
securities available for sale. At December 31, 2010, the Company’s portfolio of securities available for
sale had $283 million of gross unrealized pre-tax gains which could absorb $108 million of deferred
tax assets, which management would consider being a tax planning strategy to maximize the realization
of the deferred tax assets.
Negative Evidence
• Cumulative loss position—The Company is currently in a three-year cumulative loss position.
Excluding the $6.0 billion goodwill impairment charge during 2008 and the $200 million regulatory
charge taken in 2010, as these items were nondeductible for tax purposes, the cumulative pre-tax loss
position for 2008 through 2010 is $1.8 billion. The cumulative loss has resulted from the
unprecedented provision for loan losses of $8.5 billion during these periods, which management
believes will continue to stabilize in future periods. During 2010, the provision for loan losses
decreased $678 million to $2.9 billion, as compared to the provision for loan losses of $3.5 billion in
2009. Additionally, Regions reported positive net income available to common shareholders for the
fourth quarter of 2010, providing positive evidence regarding the Company’s earnings.
The Company believes the positive evidence, when considered in its entirety, outweighs the negative
evidence of recent pre-tax losses.
See Note 1 “Summary of Significant Accounting Policies” and Note 19 “Income Taxes” to the consolidated
financial statements for additional information about income taxes.
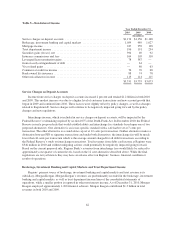
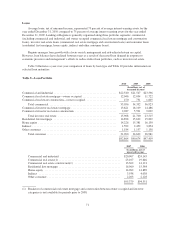
BALANCE SHEET ANALYSIS
At December 31, 2010, Regions reported total assets of $132.4 billion compared to $142.3 billion at the end
of 2009, a decrease of approximately $10.0 billion or 7 percent. The balance sheet decline reflects a decrease in
loans outstanding, primarily investor real estate balances, as well as a decrease in trading account assets.
70