Regions Bank 2010 Annual Report Download - page 161
Download and view the complete annual report
Please find page 161 of the 2010 Regions Bank annual report below. You can navigate through the pages in the report by either clicking on the pages listed below, or by using the keyword search tool below to find specific information within the annual report.-
 1
1 -
2
-
3
-
4
-
5
-
6
-
7
-
8
-
9
-
10
-
11
-
12
-
13
-
14
-
15
-
16
-
17
-
18
-
19
-
20
-
21
-
22
-
23
-
24
-
25
-
26
-
27
-
28
-
29
-
30
-
31
-
32
-
33
-
34
-
35
-
36
-
37
-
38
-
39
-
40
-
41
-
42
-
43
-
44
-
45
-
46
-
47
-
48
-
49
-
50
-
51
-
52
-
53
-
54
-
55
-
56
-
57
-
58
-
59
-
60
-
61
-
62
-
63
-
64
-
65
-
66
-
67
-
68
-
69
-
70
-
71
-
72
-
73
-
74
-
75
-
76
-
77
-
78
-
79
-
80
-
81
-
82
-
83
-
84
-
85
-
86
-
87
-
88
-
89
-
90
-
91
-
92
-
93
-
94
-
95
-
96
-
97
-
98
-
99
-
100
-
101
-
102
-
103
-
104
-
105
-
106
-
107
-
108
-
109
-
110
-
111
-
112
-
113
-
114
-
115
-
116
-
117
-
118
-
119
-
120
-
121
-
122
-
123
-
124
-
125
-
126
-
127
-
128
-
129
-
130
-
131
-
132
-
133
-
134
-
135
-
136
-
137
-
138
-
139
-
140
-
141
-
142
-
143
-
144
-
145
-
146
-
147
-
148
-
149
-
150
-
 151
151 -
 152
152 -
 153
153 -
 154
154 -
 155
155 -
 156
156 -
 157
157 -
 158
158 -
 159
159 -
 160
160 -
 161
161 -
 162
162 -
 163
163 -
 164
164 -
 165
165 -
 166
166 -
 167
167 -
 168
168 -
 169
169 -
 170
170 -
 171
171 -
172
-
173
-
174
-
175
-
176
-
177
-
178
-
179
-
180
-
181
-
182
-
183
-
184
-
185
-
186
-
187
-
188
-
189
-
190
-
191
-
192
-
193
-
194
-
195
-
196
-
197
-
198
-
199
-
200
-
201
-
202
-
203
-
204
-
205
-
206
-
207
-
208
-
209
-
210
-
211
-
212
-
213
-
214
-
215
-
216
-
217
-
218
-
219
-
220
-
221
-
222
-
223
-
224
-
225
-
226
-
227
-
228
-
229
-
230
-
231
-
232
-
233
-
234
-
235
-
236
 |
 |

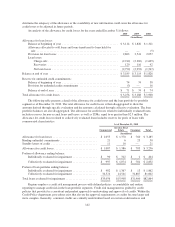
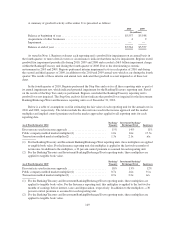
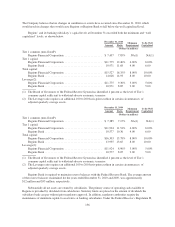
In addition to the impaired loans discussed in the preceding paragraph and detailed in the table above, there
were approximately $304 million and $317 million in non-performing loans classified as held for sale at
December 31, 2010 and 2009, respectively. The loans are larger balance credits, primarily investor real estate,
where management does not have the intent to hold these loans for the foreseeable future. The loans are carried at
an amount approximating a price which will be recoverable through the loan sale market.
At December 31, 2010, non-accrual loans including loans held for sale totaled $3.5 billion, compared to
$3.8 billion at December 31, 2009. The amount of interest income recognized in 2010, 2009 and 2008 on loans
prior to migrating to non-accrual status was approximately $47 million, $55 million and $41 million,
respectively. If these loans had been current in accordance with their original terms, approximately $165 million,
$160 million and $116 million, respectively, would have been recognized on these loans in 2010, 2009 and 2008.
At December 31, 2010 and 2009, Regions had loans contractually past due 90 days or more and still accruing of
approximately $585 million and $688 million, respectively.
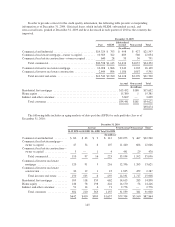
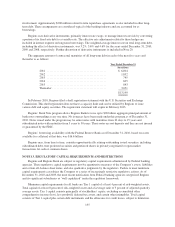
NOTE 6. SERVICING OF FINANCIAL ASSETS
Effective January 1, 2009, the Company made an election to prospectively change the policy for accounting
for residential mortgage servicing rights from the amortization method to the fair value measurement method
(see Note 1). The fair value of mortgage servicing rights is calculated using various assumptions including future
cash flows, market discount rates, expected prepayment rates, servicing costs and other factors. A significant
change in prepayments of mortgages in the servicing portfolio could result in significant changes in the valuation
adjustments, thus creating potential volatility in the carrying amount of mortgage servicing rights.
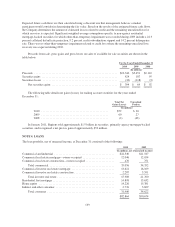
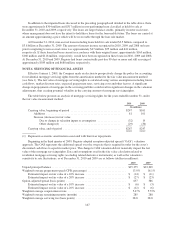
The table below presents an analysis of mortgage servicing rights for the years ended December 31, under
the fair value measurement method:
2010 2009
(In millions)
Carrying value, beginning of period ................................... $247 $161
Additions .................................................... 81 101
Increase (decrease) in fair value:
Due to change in valuation inputs or assumptions ................ (32) 19
Other changes(1) .......................................... (29) (34)
Carrying value, end of period ........................................ $267 $247
(1) Represents economic amortization associated with borrower repayments.
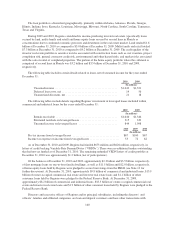
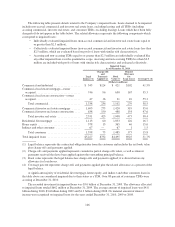
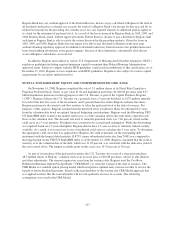
Beginning in the third quarter of 2009, Regions adopted an option-adjusted spread (“OAS”) valuation
approach. The OAS represents the additional spread over the swap rate that is required in order for the asset’s
discounted cash flows to equal its market price. The change to OAS valuation did not materially impact the fair
value of the mortgage servicing rights. Data and assumptions used in the fair value calculation related to
residential mortgage servicing rights (excluding related derivative instruments) as well as the valuation’s
sensitivity to rate fluctuations, as of December 31, 2010 and 2009 are as follows (dollars in millions):
2010 2009
Unpaid principal balance .................................................... $25,375 $23,309
Weighted-average prepayment speed (CPR; percentage) ........................... 13.0% 16.1%
Estimated impact on fair value of a 10% increase ............................ $ (14) $ (11)
Estimated impact on fair value of a 20% increase ............................ $ (27) $ (23)
Option-adjusted spread (basis points) .......................................... 657 386
Estimated impact on fair value of a 10% increase ............................ $ (6) $ (3)
Estimated impact on fair value of a 20% increase ............................ $ (12) $ (6)
Weighted-average coupon interest rate ......................................... 5.47% 5.79%
Weighted-average remaining maturity (months) ................................. 285 288
Weighted-average servicing fee (basis points) ................................... 28.8 28.8
147