Regions Bank 2010 Annual Report Download - page 196
Download and view the complete annual report
Please find page 196 of the 2010 Regions Bank annual report below. You can navigate through the pages in the report by either clicking on the pages listed below, or by using the keyword search tool below to find specific information within the annual report.-
 1
1 -
2
-
3
-
4
-
5
-
6
-
7
-
8
-
9
-
10
-
11
-
12
-
13
-
14
-
15
-
16
-
17
-
18
-
19
-
20
-
21
-
22
-
23
-
24
-
25
-
26
-
27
-
28
-
29
-
30
-
31
-
32
-
33
-
34
-
35
-
36
-
37
-
38
-
39
-
40
-
41
-
42
-
43
-
44
-
45
-
46
-
47
-
48
-
49
-
50
-
51
-
52
-
53
-
54
-
55
-
56
-
57
-
58
-
59
-
60
-
61
-
62
-
63
-
64
-
65
-
66
-
67
-
68
-
69
-
70
-
71
-
72
-
73
-
74
-
75
-
76
-
77
-
78
-
79
-
80
-
81
-
82
-
83
-
84
-
85
-
86
-
87
-
88
-
89
-
90
-
91
-
92
-
93
-
94
-
95
-
96
-
97
-
98
-
99
-
100
-
101
-
102
-
103
-
104
-
105
-
106
-
107
-
108
-
109
-
110
-
111
-
112
-
113
-
114
-
115
-
116
-
117
-
118
-
119
-
120
-
121
-
122
-
123
-
124
-
125
-
126
-
127
-
128
-
129
-
130
-
131
-
132
-
133
-
134
-
135
-
136
-
137
-
138
-
139
-
140
-
141
-
142
-
143
-
144
-
145
-
146
-
147
-
148
-
149
-
150
-
151
-
152
-
153
-
154
-
155
-
156
-
157
-
158
-
159
-
160
-
161
-
162
-
163
-
164
-
165
-
166
-
167
-
168
-
169
-
170
-
171
-
172
-
173
-
174
-
175
-
176
-
177
-
178
-
179
-
180
-
181
-
182
-
183
-
184
-
185
-
 186
186 -
 187
187 -
 188
188 -
 189
189 -
 190
190 -
 191
191 -
 192
192 -
 193
193 -
 194
194 -
 195
195 -
 196
196 -
 197
197 -
 198
198 -
 199
199 -
 200
200 -
 201
201 -
 202
202 -
 203
203 -
 204
204 -
 205
205 -
 206
206 -
207
-
208
-
209
-
210
-
211
-
212
-
213
-
214
-
215
-
216
-
217
-
218
-
219
-
220
-
221
-
222
-
223
-
224
-
225
-
226
-
227
-
228
-
229
-
230
-
231
-
232
-
233
-
234
-
235
-
236
 |
 |

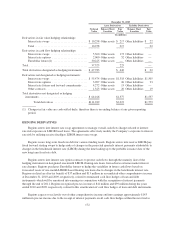
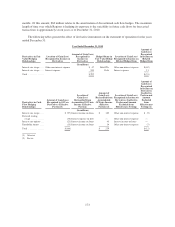
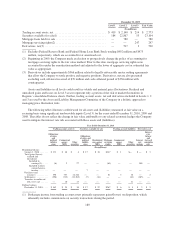
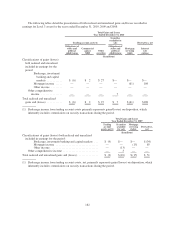
The following tables detail the presentation of both realized and unrealized gains and losses recorded in
earnings for Level 3 assets for the years ended December 31, 2010, 2009 and 2008:
Total Gains and Losses
Year Ended December 31, 2010
Trading account assets(1)
Securities
available for
sale Derivatives, net
Obligations of
states and
political
subdivisions
Commercial
agency
MBS
Other
securities
Obligations of
states and
political
subdivisions
Mortgage
servicing
rights
Interest
rate
options
(In millions)
Classifications of gains (losses)
both realized and unrealized
included in earnings for the
period:
Brokerage, investment
banking and capital
markets ........... $ (6) $ 2 $ 27 $— $— $—
Mortgage income ..... — — — — (61) 108
Other income ........ — — — — — —
Other comprehensive
income ............... — — — 7 — —
Total realized and unrealized
gains and (losses) ........... $ (6) $ 2 $ 27 $ 7 $(61) $108
(1) Brokerage income from trading account assets primarily represents gains/(losses) on disposition, which
inherently includes commissions on security transactions during the period.
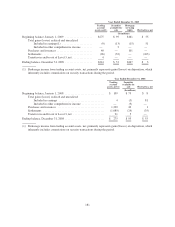
Total Gains and Losses
Year Ended December 31, 2009
Trading
account
assets, net(1)
Securities
available
for sale
Mortgage
servicing
rights
Derivatives,
net
(In millions)
Classifications of gains (losses) both realized and unrealized
included in earnings for the period:
Brokerage, investment banking and capital markets . . . $ (9) $— $— $ (34)
Mortgage income .............................. — — (15) 85
Other income .................................. — (13) — —
Other comprehensive income ......................... — 3 — —
Total realized and unrealized gains and (losses) ............... $ (9) $(10) $ (15) $ 51
(1) Brokerage income from trading account assets, net, primarily represents gains/(losses) on disposition, which
inherently includes commissions on security transactions during the period.
182