Regions Bank 2010 Annual Report Download - page 88
Download and view the complete annual report
Please find page 88 of the 2010 Regions Bank annual report below. You can navigate through the pages in the report by either clicking on the pages listed below, or by using the keyword search tool below to find specific information within the annual report.-
 1
1 -
2
-
3
-
4
-
5
-
6
-
7
-
8
-
9
-
10
-
11
-
12
-
13
-
14
-
15
-
16
-
17
-
18
-
19
-
20
-
21
-
22
-
23
-
24
-
25
-
26
-
27
-
28
-
29
-
30
-
31
-
32
-
33
-
34
-
35
-
36
-
37
-
38
-
39
-
40
-
41
-
42
-
43
-
44
-
45
-
46
-
47
-
48
-
49
-
50
-
51
-
52
-
53
-
54
-
55
-
56
-
57
-
58
-
59
-
60
-
61
-
62
-
63
-
64
-
65
-
66
-
67
-
68
-
69
-
70
-
71
-
72
-
73
-
74
-
75
-
76
-
77
-
 78
78 -
 79
79 -
 80
80 -
 81
81 -
 82
82 -
 83
83 -
 84
84 -
 85
85 -
 86
86 -
 87
87 -
 88
88 -
 89
89 -
 90
90 -
 91
91 -
 92
92 -
 93
93 -
 94
94 -
 95
95 -
 96
96 -
 97
97 -
 98
98 -
99
-
100
-
101
-
102
-
103
-
104
-
105
-
106
-
107
-
108
-
109
-
110
-
111
-
112
-
113
-
114
-
115
-
116
-
117
-
118
-
119
-
120
-
121
-
122
-
123
-
124
-
125
-
126
-
127
-
128
-
129
-
130
-
131
-
132
-
133
-
134
-
135
-
136
-
137
-
138
-
139
-
140
-
141
-
142
-
143
-
144
-
145
-
146
-
147
-
148
-
149
-
150
-
151
-
152
-
153
-
154
-
155
-
156
-
157
-
158
-
159
-
160
-
161
-
162
-
163
-
164
-
165
-
166
-
167
-
168
-
169
-
170
-
171
-
172
-
173
-
174
-
175
-
176
-
177
-
178
-
179
-
180
-
181
-
182
-
183
-
184
-
185
-
186
-
187
-
188
-
189
-
190
-
191
-
192
-
193
-
194
-
195
-
196
-
197
-
198
-
199
-
200
-
201
-
202
-
203
-
204
-
205
-
206
-
207
-
208
-
209
-
210
-
211
-
212
-
213
-
214
-
215
-
216
-
217
-
218
-
219
-
220
-
221
-
222
-
223
-
224
-
225
-
226
-
227
-
228
-
229
-
230
-
231
-
232
-
233
-
234
-
235
-
236
 |
 |

Securities
Regions utilizes the securities portfolio to manage liquidity, interest rate risk, and regulatory capital, as well
as to take advantage of market conditions to generate a favorable return on investments without undue risk. The
portfolio consists primarily of high-quality mortgage-backed and asset-backed securities. Securities represented
18 percent of total assets at December 31, 2010 compared to 17 percent at December 31, 2009. In 2010, total
securities, which are almost entirely classified as available for sale, decreased $787 million, or 3 percent.
The “Market Risk-Interest Rate Risk” section, found later in this report, further explains Regions’ interest
rate risk management practices. The weighted-average yield earned on securities, less equities, was 3.42 percent
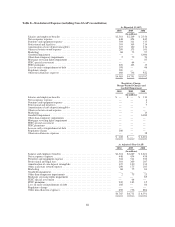
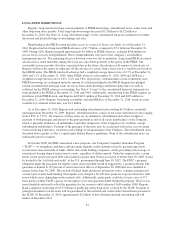
in 2010 and 4.22 percent in 2009. Table 11 “Securities” illustrates the carrying values of total securities by
category.
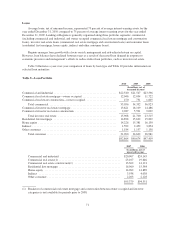
Table 11—Securities
2010 2009 2008
(In millions)
U.S. Treasury securities ................................... $ 96 $ 57 $ 901
Federal agency securities .................................. 21 51 1,705
Obligations of states and political subdivisions ................. 30 70 757
Mortgage-backed securities: ...............................
Residential agency ................................... 21,857 22,700 12,353
Residential non-agency ............................... 22 36 1,239
Commercial agency .................................. 112 21 757
Commercial non-agency .............................. 100 — —
Other debt securities ...................................... 27 21 21
Equity securities ......................................... 1,048 1,144 1,164
$23,313 $24,100 $18,897
From time to time, Regions sells securities classified as available for sale as part of the Company’s asset/
liability management strategy. As part of this process, in the first quarter of 2010, Regions sold approximately
$1.4 billion of residential agency securities available for sale and recognized a gain of approximately $59
million. The proceeds were reinvested into newer issue residential agency securities with slightly longer
durations. Additionally, during the fourth quarter of 2010, Regions repositioned its agency mortgage-backed
securities portfolio in order to mitigate prepayment risk associated with that portfolio. Regions sold
approximately $8.2 billion of available for sale securities which primarily consisted of agency mortgage-backed
securities. A gain of approximately $333 million was recognized on the sale. Proceeds from the fourth quarter
sales were reinvested in similar agency securities with lower coupons and longer durations.
Regions continually analyzes relative value to the Company across fixed income asset classes. The current
portfolio weighting to agency mortgage-backed securities is not optimal over a longer horizon. Agency
mortgage-backed securities have an advantageous credit and liquidity profile, but also carry more prepayment
risk than other types of securities. Regions expects to prudently balance these benefits and risks by expanding
asset classes during 2011 and 2012, as appropriate opportunities arise.
Net unrealized gains and losses in the securities available for sale portfolio are included in stockholders’
equity as accumulated other comprehensive income or loss, net of tax. At December 31, 2010, securities
available for sale included a net unrealized gain of $120 million, which represented the difference between the
estimated fair value of these securities as of year-end and their amortized cost. The net unrealized gain represents
$283 million in gross unrealized gains and $163 million in gross unrealized losses. At December 31, 2009,
securities available for sale included a net unrealized gain of $431 million, comprised of $495 million in gross
unrealized gains and $64 million in gross unrealized losses.
74