Regions Bank 2010 Annual Report Download - page 184
Download and view the complete annual report
Please find page 184 of the 2010 Regions Bank annual report below. You can navigate through the pages in the report by either clicking on the pages listed below, or by using the keyword search tool below to find specific information within the annual report.-
 1
1 -
2
-
3
-
4
-
5
-
6
-
7
-
8
-
9
-
10
-
11
-
12
-
13
-
14
-
15
-
16
-
17
-
18
-
19
-
20
-
21
-
22
-
23
-
24
-
25
-
26
-
27
-
28
-
29
-
30
-
31
-
32
-
33
-
34
-
35
-
36
-
37
-
38
-
39
-
40
-
41
-
42
-
43
-
44
-
45
-
46
-
47
-
48
-
49
-
50
-
51
-
52
-
53
-
54
-
55
-
56
-
57
-
58
-
59
-
60
-
61
-
62
-
63
-
64
-
65
-
66
-
67
-
68
-
69
-
70
-
71
-
72
-
73
-
74
-
75
-
76
-
77
-
78
-
79
-
80
-
81
-
82
-
83
-
84
-
85
-
86
-
87
-
88
-
89
-
90
-
91
-
92
-
93
-
94
-
95
-
96
-
97
-
98
-
99
-
100
-
101
-
102
-
103
-
104
-
105
-
106
-
107
-
108
-
109
-
110
-
111
-
112
-
113
-
114
-
115
-
116
-
117
-
118
-
119
-
120
-
121
-
122
-
123
-
124
-
125
-
126
-
127
-
128
-
129
-
130
-
131
-
132
-
133
-
134
-
135
-
136
-
137
-
138
-
139
-
140
-
141
-
142
-
143
-
144
-
145
-
146
-
147
-
148
-
149
-
150
-
151
-
152
-
153
-
154
-
155
-
156
-
157
-
158
-
159
-
160
-
161
-
162
-
163
-
164
-
165
-
166
-
167
-
168
-
169
-
170
-
171
-
172
-
173
-
 174
174 -
 175
175 -
 176
176 -
 177
177 -
 178
178 -
 179
179 -
 180
180 -
 181
181 -
 182
182 -
 183
183 -
 184
184 -
 185
185 -
 186
186 -
 187
187 -
 188
188 -
 189
189 -
 190
190 -
 191
191 -
 192
192 -
 193
193 -
 194
194 -
195
-
196
-
197
-
198
-
199
-
200
-
201
-
202
-
203
-
204
-
205
-
206
-
207
-
208
-
209
-
210
-
211
-
212
-
213
-
214
-
215
-
216
-
217
-
218
-
219
-
220
-
221
-
222
-
223
-
224
-
225
-
226
-
227
-
228
-
229
-
230
-
231
-
232
-
233
-
234
-
235
-
236
 |
 |

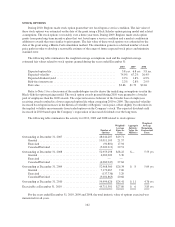
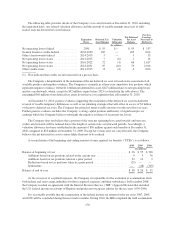
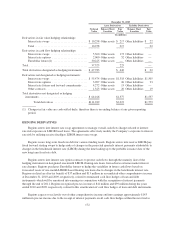
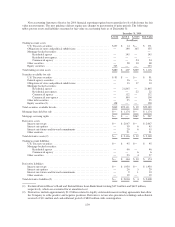
The following table provides details of the Company’s tax carryforwards at December 31, 2010, including
the expiration dates, any related valuation allowance and the amount of taxable earnings necessary to fully
realize each net deferred tax asset balance:
Expiration
Dates
Deferred Tax
Asset Balance
Valuation
Allowance
Net Deferred
Tax Asset
Balance
Pre-Tax
Earnings
Necessary to
Realize(1)
(In millions)
Net operating losses-federal ............... 2030 $ 55 $— $ 55 $ 157
General business credits-federal ............ 2029-2030 185 — 185 N/A
Other carryforwards-federal ............... 2014-2015 5 — 5 15
Net operating losses-states ................. 2012-2015 7 (6) 1 14
Net operating losses-states ................. 2016-2022 72 (4) 68 1,617
Net operating losses-states ................. 2023-2031 95 (16) 79 2,014
Other credits-states ...................... 2011-2015 8 (4) 4 N/A
(1) N/A indicates that credits are not measured on a pre-tax basis.
The Company’s determination of the realization of the net deferred tax asset is based on its assessment of all
available positive and negative evidence. The Company is currently in a three-year cumulative loss position, which
represents negative evidence. Of the $1.4 billion net deferred tax asset, $427 million relates to net operating losses
and tax carryforwards, which, except for $92 million, expire before 2023 (as detailed in the table above). The
remaining $960 million of net deferred tax assets do not have a set expiration date at December 31, 2010.
At December 31, 2010, positive evidence supporting the realization of the deferred tax asset includes the
reversal of taxable temporary differences as well as tax planning strategies that will offset in excess of $1 billion
of the gross deferred tax asset. The Company has projected future taxable income over the next five tax years.
Further positive evidence includes the Company’s strong capital position and history of significant pre-tax
earnings which the Company believes outweighs the negative evidence of recent pre-tax losses.
The Company does not believe that a portion of the state net operating loss carryforwards and state tax
credit carryforwards will be realized due to the length of certain state carryforward periods. Accordingly, a
valuation allowance has been established in the amount of $30 million against such benefits at December 31,
2010 compared to $23 million at December 31, 2009. Except for certain state tax carryforwards, the Company
believes the net deferred tax asset is more-likely-than-not to be realized.
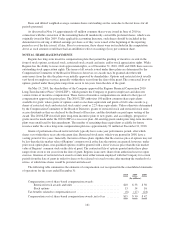
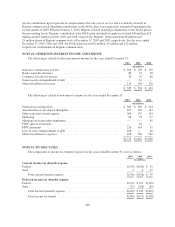
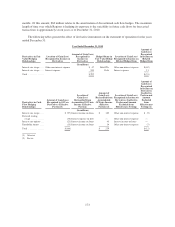
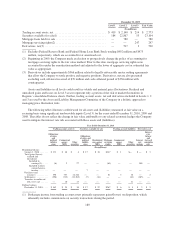
A reconciliation of the beginning and ending amount of unrecognized tax benefits (“UTBs”) is as follows:
2010 2009 2008
(In millions)
Balance at beginning of year ................................................. $ 26 $ 55 $746
Additions based on tax positions related to the current year ..................... 9 5 76
Additions based on tax positions taken in a prior period ........................ 32 14 2
Reductions based on tax positions taken in a prior period ...................... (29) — —
Settlements ........................................................... — (48) (769)
Balance at end of year ...................................................... $ 38 $ 26 $ 55
As the successor of acquired taxpayers, the Company is responsible for the resolution of examinations from
both federal and state taxing authorities for those acquired taxpayers and their subsidiaries. In December 2008,
the Company reached an agreement with the Internal Revenue Service (“IRS”) Appeals Division that included
the U.S. federal income tax returns of Regions and predecessor taxpayer entities for the tax years 1999-2006.
It is reasonably possible that the examination of the federal income tax returns for the tax years 2007, 2008
and 2009 will be concluded during the next twelve months. During 2010, the IRS completed the field examination
170