Regions Bank 2010 Annual Report Download - page 79
Download and view the complete annual report
Please find page 79 of the 2010 Regions Bank annual report below. You can navigate through the pages in the report by either clicking on the pages listed below, or by using the keyword search tool below to find specific information within the annual report.-
 1
1 -
2
-
3
-
4
-
5
-
6
-
7
-
8
-
9
-
10
-
11
-
12
-
13
-
14
-
15
-
16
-
17
-
18
-
19
-
20
-
21
-
22
-
23
-
24
-
25
-
26
-
27
-
28
-
29
-
30
-
31
-
32
-
33
-
34
-
35
-
36
-
37
-
38
-
39
-
40
-
41
-
42
-
43
-
44
-
45
-
46
-
47
-
48
-
49
-
50
-
51
-
52
-
53
-
54
-
55
-
56
-
57
-
58
-
59
-
60
-
61
-
62
-
63
-
64
-
65
-
66
-
67
-
68
-
 69
69 -
 70
70 -
 71
71 -
 72
72 -
 73
73 -
 74
74 -
 75
75 -
 76
76 -
 77
77 -
 78
78 -
 79
79 -
 80
80 -
 81
81 -
 82
82 -
 83
83 -
 84
84 -
 85
85 -
 86
86 -
 87
87 -
 88
88 -
 89
89 -
90
-
91
-
92
-
93
-
94
-
95
-
96
-
97
-
98
-
99
-
100
-
101
-
102
-
103
-
104
-
105
-
106
-
107
-
108
-
109
-
110
-
111
-
112
-
113
-
114
-
115
-
116
-
117
-
118
-
119
-
120
-
121
-
122
-
123
-
124
-
125
-
126
-
127
-
128
-
129
-
130
-
131
-
132
-
133
-
134
-
135
-
136
-
137
-
138
-
139
-
140
-
141
-
142
-
143
-
144
-
145
-
146
-
147
-
148
-
149
-
150
-
151
-
152
-
153
-
154
-
155
-
156
-
157
-
158
-
159
-
160
-
161
-
162
-
163
-
164
-
165
-
166
-
167
-
168
-
169
-
170
-
171
-
172
-
173
-
174
-
175
-
176
-
177
-
178
-
179
-
180
-
181
-
182
-
183
-
184
-
185
-
186
-
187
-
188
-
189
-
190
-
191
-
192
-
193
-
194
-
195
-
196
-
197
-
198
-
199
-
200
-
201
-
202
-
203
-
204
-
205
-
206
-
207
-
208
-
209
-
210
-
211
-
212
-
213
-
214
-
215
-
216
-
217
-
218
-
219
-
220
-
221
-
222
-
223
-
224
-
225
-
226
-
227
-
228
-
229
-
230
-
231
-
232
-
233
-
234
-
235
-
236
 |
 |
In January 2011, Regions sold approximately $1.5 billion in securities, primarily agency mortgage-backed
securities, and recognized a net pre-tax gain of approximately $52 million.
Leveraged Lease Termination Gains
A 2008 settlement with the IRS negatively impacted the economics of Regions’ leveraged lease portfolio. In
addition, there was a mutual desire with lessees to terminate certain leases within this portfolio. Accordingly, the
Company decided to terminate certain of these leases in 2010 and 2009, resulting in gains of $78 million and
$587 million, respectively. However, these gains were essentially offset by related income tax expense of $74
million and $589 million, respectively, resulting in a minimal impact to net income.
Gain on Early Extinguishment of Debt
During 2009, Regions completed an exchange of common shares for outstanding 6.625 percent Trust
Preferred Securities issued by Regions Financing Trust II (“the Trust”). In connection with this exchange, the
Company recognized a gain on extinguishment of junior subordinated debt issued to the Trust. The
extinguishment resulted in an increase to non-interest income of $61 million in 2009. For further details, see
Note 14 “Stockholders’ Equity and Comprehensive Income (Loss)” to the consolidated financial statements.
Visa-Related Gains
In early 2008, Visa executed an initial public offering (“IPO”) of common stock and, in connection with the
IPO, Regions’ ownership interest in Visa was converted into approximately 3.8 million shares of Class B
common stock. In late 2008, Regions recognized a $63 million gain upon the redemption of these shares. In
2009, Regions sold its remaining Visa Class B common stock resulting in an $80 million gain. For further
details, see Note 23 “Commitments, Contingencies, and Guarantees” to the consolidated financial statements.
Bank-Owned Life Insurance
Bank-owned life insurance income increased 19 percent to $88 million in 2010, compared to $74 million in
2009. This increase is primarily due to changes in crediting rates related to the insurance policies.
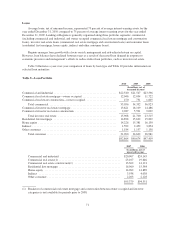
NON-INTEREST EXPENSE
The following section contains a discussion of non-interest expense from continuing operations. The largest
components of non-interest expense are salaries and employee benefits, net occupancy expense and furniture and
equipment expense. Non-interest expense in 2010 included a $200 million regulatory charge. Non-interest
expense, excluding the regulatory charge, increased $34 million, or 1 percent, to $4.8 billion in 2010.
Non-interest expense in 2008 included a $6.0 billion non-cash goodwill impairment charge and merger-related
charges totaling $201 million.
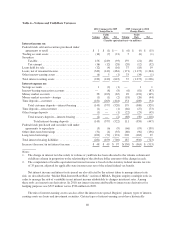
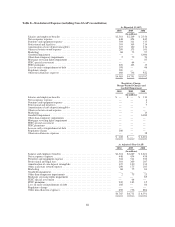
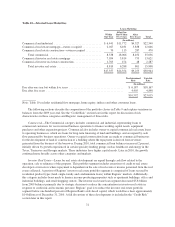
Table 8 “Non-Interest Expense (including Non-GAAP reconciliation)” presents major non-interest expense
components, both including and excluding the regulatory charge, merger-related charges and goodwill
impairment, for the years ended December 31, 2010, 2009 and 2008. Management believes Table 8 is useful in
evaluating trends in non-interest expense. Note that merger-related charges as shown in this table relate to
Regions’ acquisition of AmSouth in November 2006. See Table 2 “GAAP to Non-GAAP Reconciliation” and the
text preceding it for further discussion of non-GAAP financial measures.
65