Regions Bank 2010 Annual Report Download - page 93
Download and view the complete annual report
Please find page 93 of the 2010 Regions Bank annual report below. You can navigate through the pages in the report by either clicking on the pages listed below, or by using the keyword search tool below to find specific information within the annual report.-
 1
1 -
2
-
3
-
4
-
5
-
6
-
7
-
8
-
9
-
10
-
11
-
12
-
13
-
14
-
15
-
16
-
17
-
18
-
19
-
20
-
21
-
22
-
23
-
24
-
25
-
26
-
27
-
28
-
29
-
30
-
31
-
32
-
33
-
34
-
35
-
36
-
37
-
38
-
39
-
40
-
41
-
42
-
43
-
44
-
45
-
46
-
47
-
48
-
49
-
50
-
51
-
52
-
53
-
54
-
55
-
56
-
57
-
58
-
59
-
60
-
61
-
62
-
63
-
64
-
65
-
66
-
67
-
68
-
69
-
70
-
71
-
72
-
73
-
74
-
75
-
76
-
77
-
78
-
79
-
80
-
81
-
82
-
 83
83 -
 84
84 -
 85
85 -
 86
86 -
 87
87 -
 88
88 -
 89
89 -
 90
90 -
 91
91 -
 92
92 -
 93
93 -
 94
94 -
 95
95 -
 96
96 -
 97
97 -
 98
98 -
 99
99 -
 100
100 -
 101
101 -
 102
102 -
 103
103 -
104
-
105
-
106
-
107
-
108
-
109
-
110
-
111
-
112
-
113
-
114
-
115
-
116
-
117
-
118
-
119
-
120
-
121
-
122
-
123
-
124
-
125
-
126
-
127
-
128
-
129
-
130
-
131
-
132
-
133
-
134
-
135
-
136
-
137
-
138
-
139
-
140
-
141
-
142
-
143
-
144
-
145
-
146
-
147
-
148
-
149
-
150
-
151
-
152
-
153
-
154
-
155
-
156
-
157
-
158
-
159
-
160
-
161
-
162
-
163
-
164
-
165
-
166
-
167
-
168
-
169
-
170
-
171
-
172
-
173
-
174
-
175
-
176
-
177
-
178
-
179
-
180
-
181
-
182
-
183
-
184
-
185
-
186
-
187
-
188
-
189
-
190
-
191
-
192
-
193
-
194
-
195
-
196
-
197
-
198
-
199
-
200
-
201
-
202
-
203
-
204
-
205
-
206
-
207
-
208
-
209
-
210
-
211
-
212
-
213
-
214
-
215
-
216
-
217
-
218
-
219
-
220
-
221
-
222
-
223
-
224
-
225
-
226
-
227
-
228
-
229
-
230
-
231
-
232
-
233
-
234
-
235
-
236
 |
 |

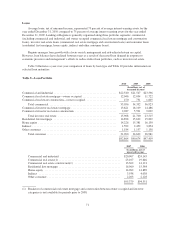
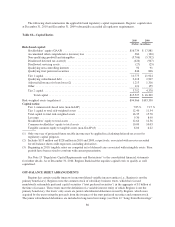
The sensitivity of Regions’ deposit rates to changes in market interest rates is reflected in Regions’ average
interest rate paid on interest-bearing deposits. The rate paid on interest-bearing deposits decreased to 1.04 percent
in 2010 from 1.73 percent in 2009, driven by the expiration of time deposits, the positive mix shift to lower
customer products, and continuation of the low interest rate environment throughout 2010. Table 15 “Maturity of
Time Deposits of $100,000 or More” presents maturities of time deposits of $100,000 or more at December 31,
2010 and 2009.
Table 15—Maturity of Time Deposits of $100,000 or More
2010 2009
(In millions)
Time deposits of $100,000 or more, maturing in:
3 months or less .......................................................... $1,878 $ 3,521
Over 3 through 6 months ................................................... 1,396 1,332
Over 6 through 12 months .................................................. 1,898 2,442
Over 12 months .......................................................... 3,679 5,349
$8,851 $12,644
SHORT-TERM BORROWINGS
See Note 11 “Short-Term Borrowings” to the consolidated financial statements for a summary of these
borrowings at December 31, 2010 and 2009.
COMPANY FUNDING SOURCES
Federal funds purchased and securities sold under agreements to repurchase used for funding purposes totaled
$782 million at December 31, 2010, compared to $478 million at year-end 2009. The level of Federal funds
purchased and securities sold under agreements to repurchase can fluctuate significantly on a day-to-day basis,
depending on funding requirements and which sources of funds are used to satisfy those needs. All such
arrangements are considered typical of the banking and brokerage industries and are accounted for as borrowings.
As another source of funding, the Company utilized short-term borrowings through the issuance of FHLB
advances. FHLB borrowings are used to satisfy short-term and long-term borrowing needs and can also fluctuate
between periods. Short-term FHLB borrowings totaled $500 million at December 31, 2010 compared to $1.0
billion at December 31, 2009. The Company continues to utilize FHLB borrowings as a means to reduce
overnight funding and diversify into slightly longer-term maturities at preferable rates. See Note 12 “Long-Term
Borrowings”, to the consolidated financial statements for further discussion of Regions’ borrowing capacity with
the FHLB.
As of December 31, 2010, Regions had $118 million outstanding in the Federal Reserve’s Treasury, Tax,
and Loan Program, compared to $7 million at December 31, 2009. At December 31, 2010, Regions could borrow
a maximum of approximately $16.6 billion from the Federal Reserve Bank Discount Window. See Note 4
“Loans” to the consolidated financial statements for further detail and discussion of loans pledged to the Federal
Reserve Bank at December 31, 2010 and 2009.
Other short-term borrowings totaled $95 million at December 31, 2010 compared to $0 at December 31,
2009. This balance includes certain lines of credit that Morgan Keegan maintains with unaffiliated banks. The
lines of credit provided for maximum borrowings of $640 million at December 31, 2010 and $585 million
December 31, 2009.
During 2008, Regions was an active participant in the Federal Reserve’s Term Auction Facility (“TAF”)
program, which was designed to address pressures in short-term funding markets, Regions continued to
participate in TAF in the first half of 2009 but completely exited the program in July of 2009.
79