Regions Bank 2010 Annual Report Download - page 107
Download and view the complete annual report
Please find page 107 of the 2010 Regions Bank annual report below. You can navigate through the pages in the report by either clicking on the pages listed below, or by using the keyword search tool below to find specific information within the annual report.-
 1
1 -
2
-
3
-
4
-
5
-
6
-
7
-
8
-
9
-
10
-
11
-
12
-
13
-
14
-
15
-
16
-
17
-
18
-
19
-
20
-
21
-
22
-
23
-
24
-
25
-
26
-
27
-
28
-
29
-
30
-
31
-
32
-
33
-
34
-
35
-
36
-
37
-
38
-
39
-
40
-
41
-
42
-
43
-
44
-
45
-
46
-
47
-
48
-
49
-
50
-
51
-
52
-
53
-
54
-
55
-
56
-
57
-
58
-
59
-
60
-
61
-
62
-
63
-
64
-
65
-
66
-
67
-
68
-
69
-
70
-
71
-
72
-
73
-
74
-
75
-
76
-
77
-
78
-
79
-
80
-
81
-
82
-
83
-
84
-
85
-
86
-
87
-
88
-
89
-
90
-
91
-
92
-
93
-
94
-
95
-
96
-
 97
97 -
 98
98 -
 99
99 -
 100
100 -
 101
101 -
 102
102 -
 103
103 -
 104
104 -
 105
105 -
 106
106 -
 107
107 -
 108
108 -
 109
109 -
 110
110 -
 111
111 -
 112
112 -
 113
113 -
 114
114 -
 115
115 -
 116
116 -
 117
117 -
118
-
119
-
120
-
121
-
122
-
123
-
124
-
125
-
126
-
127
-
128
-
129
-
130
-
131
-
132
-
133
-
134
-
135
-
136
-
137
-
138
-
139
-
140
-
141
-
142
-
143
-
144
-
145
-
146
-
147
-
148
-
149
-
150
-
151
-
152
-
153
-
154
-
155
-
156
-
157
-
158
-
159
-
160
-
161
-
162
-
163
-
164
-
165
-
166
-
167
-
168
-
169
-
170
-
171
-
172
-
173
-
174
-
175
-
176
-
177
-
178
-
179
-
180
-
181
-
182
-
183
-
184
-
185
-
186
-
187
-
188
-
189
-
190
-
191
-
192
-
193
-
194
-
195
-
196
-
197
-
198
-
199
-
200
-
201
-
202
-
203
-
204
-
205
-
206
-
207
-
208
-
209
-
210
-
211
-
212
-
213
-
214
-
215
-
216
-
217
-
218
-
219
-
220
-
221
-
222
-
223
-
224
-
225
-
226
-
227
-
228
-
229
-
230
-
231
-
232
-
233
-
234
-
235
-
236
 |
 |

unsecured sources. However, Regions has continued to test those markets and has entered them only when
opportunistic borrowing is available. Regions has chosen to focus on using short-term secured sources of
funding.
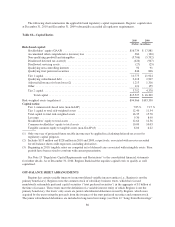
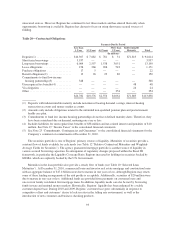
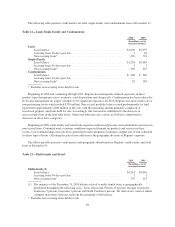
Table 20—Contractual Obligations
Payments Due By Period
Less than
1 Year 1-3 Years 4-5 Years
More than
5 Years
Indeterminable
Maturity Total
(In millions)
Deposits(1) ........................ $14,307 $ 7,682 $ 781 $ 31 $71,813 $ 94,614
Short-term borrowings ............... 3,937 — — — — 3,937
Long-term borrowings ............... 6,004 2,597 1,538 3,051 — 13,190
Lease obligations ................... 156 266 206 543 — 1,171
Purchase obligations ................. 17 5 — — — 22
Benefit obligations(2) ................ 13 26 29 82 — 150
Commitments to fund low income
housing partnerships(3) ............ 348 — — — — 348
Unrecognized tax benefits(4) .......... — — — — 48 48
Visa litigation ...................... — — — — 24 24
Other ............................. — — — 354 — 354
$24,782 $10,576 $2,554 $4,061 $71,885 $113,858
(1) Deposits with indeterminable maturity include non-interest bearing demand, savings, interest-bearing
transaction accounts and money market accounts.
(2) Amounts only include obligations related to the unfunded non-qualified pension plan and postretirement
health care plan.
(3) Commitments to fund low income housing partnerships do not have defined maturity dates. Therefore, they
have been considered due on demand, maturing one year or less.
(4) Includes liabilities for unrecognized tax benefits of $38 million and tax-related interest and penalties of $10
million. See Note 19 “Income Taxes” to the consoliated financial statements.
(5) See Note 23 “Commitments, Contingencies and Guarantees” to the consolidated financial statements for the
Company’s commercial commitments at December 31, 2010.
The securities portfolio is one of Regions’ primary sources of liquidity. Maturities of securities provide a
constant flow of funds available for cash needs (see Table 12 “Relative Contractual Maturities and Weighted-
Average Yields for Securities”). The agency guaranteed mortgage portfolio is another source of liquidity in
various secured borrowing capacities. In anticipation of regulatory changes proposed within the Basel III
framework, in particular the Liquidity Coverage Ratio, Regions increased its holdings in securities backed by
GNMA, which are explicitly backed by the U.S. Government.
Maturities in the loan portfolio also provide a steady flow of funds (see Table 10 “Selected Loan
Maturities”). At December 31, 2010, commercial loans and investor real estate mortgage and construction loans
with an aggregate balance of $17.4 billion were due to mature in one year or less, although Regions may renew
some of these lending arrangements if the risk profile is acceptable. Additionally, securities of $20 million were
due to mature in one year or less. Additional funds are provided from payments on consumer loans and
one-to-four family residential first mortgage loans. In addition, liquidity needs can also be met by borrowing
funds in state and national money markets. Historically, Regions’ liquidity has been enhanced by a stable
customer deposit base. During 2010 and 2009, Regions’ customer base grew substantially in response to
competitive offers and customers’ desire to lock-in rates in the falling rate environment, as well as the
introduction of new consumer and business checking products.
93