Bank of America 2007 Annual Report Download - page 101
Download and view the complete annual report
Please find page 101 of the 2007 Bank of America annual report below. You can navigate through the pages in the report by either clicking on the pages listed below, or by using the keyword search tool below to find specific information within the annual report.-
 1
1 -
2
-
3
-
4
-
5
-
6
-
7
-
8
-
9
-
10
-
11
-
12
-
13
-
14
-
15
-
16
-
17
-
18
-
19
-
20
-
21
-
22
-
23
-
24
-
25
-
26
-
27
-
28
-
29
-
30
-
31
-
32
-
33
-
34
-
35
-
36
-
37
-
38
-
39
-
40
-
41
-
42
-
43
-
44
-
45
-
46
-
47
-
48
-
49
-
50
-
51
-
52
-
53
-
54
-
55
-
56
-
57
-
58
-
59
-
60
-
61
-
62
-
63
-
64
-
65
-
66
-
67
-
68
-
69
-
70
-
71
-
72
-
73
-
74
-
75
-
76
-
77
-
78
-
79
-
80
-
81
-
82
-
83
-
84
-
85
-
86
-
87
-
88
-
89
-
90
-
 91
91 -
 92
92 -
 93
93 -
 94
94 -
 95
95 -
 96
96 -
 97
97 -
 98
98 -
 99
99 -
 100
100 -
 101
101 -
 102
102 -
 103
103 -
 104
104 -
 105
105 -
 106
106 -
 107
107 -
 108
108 -
 109
109 -
 110
110 -
 111
111 -
112
-
113
-
114
-
115
-
116
-
117
-
118
-
119
-
120
-
121
-
122
-
123
-
124
-
125
-
126
-
127
-
128
-
129
-
130
-
131
-
132
-
133
-
134
-
135
-
136
-
137
-
138
-
139
-
140
-
141
-
142
-
143
-
144
-
145
-
146
-
147
-
148
-
149
-
150
-
151
-
152
-
153
-
154
-
155
-
156
-
157
-
158
-
159
-
160
-
161
-
162
-
163
-
164
-
165
-
166
-
167
-
168
-
169
-
170
-
171
-
172
-
173
-
174
-
175
-
176
-
177
-
178
-
179
 |
 |

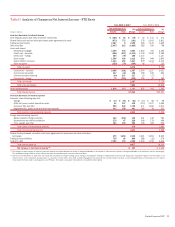
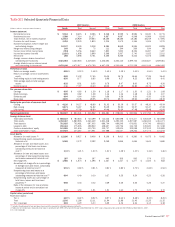
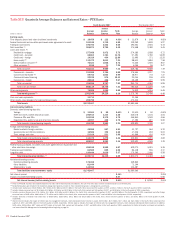
Table II Analysis of Changes in Net Interest Income – FTE Basis
From 2006 to 2007 From 2005 to 2006
Due to Change in
(1)
Net
Change
Due to Change in
(1)
Net
Change
(Dollars in millions) Volume Rate Volume Rate
Increase (decrease) in interest income
Time deposits placed and other short-term investments
$ (102) $ 83 $ (19)
$ 43 $ 131 $ 174
Federal funds sold and securities purchased under agreements to resell
(873) 772 (101)
178 2,633 2,811
Trading account assets
2,187 8 2,195
526 1,143 1,669
Debt securities
(2,037) 212 (1,825)
282 516 798
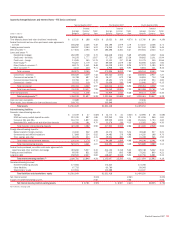
Loans and leases:
Residential mortgage
3,159 345 3,504
1,843 341 2,184
Credit card – domestic
(806) (607) (1,413)
1,139 1,246 2,385
Credit card – foreign
404 (49) 355
1,147 – 1,147
Home equity
1,506 106 1,612
893 949 1,842
Direct/Indirect consumer
1,323 494 1,817
879 1,234 2,113
Other consumer
(329) (70) (399)
46 77 123
Total consumer
5,476
9,794
Commercial – domestic
2,088 (101) 1,987
1,504 1,127 2,631
Commercial real estate
447 (42) 405
159 535 694
Commercial lease financing
(20) 237 217
20 (17) 3
Commercial – foreign
70 (292) (222)
352 30 382
Total commercial
2,387
3,710
Total loans and leases
7,863
13,504
Other earning assets
1,016 115 1,131
952 443 1,395
Total interest income
$ 9,244
$20,351
Increase (decrease) in interest expense
Domestic interest-bearing deposits:
Savings
$ (17) $ (64) $ (81)
$ (10) $ 68 $ 58
NOW and money market deposit accounts
41 397 438
(113) 1,197 1,084
Consumer CDs and IRAs
959 836 1,795
671 1,260 1,931
Negotiable CDs, public funds and other time deposits
333 158 491
195 38 233
Total domestic interest-bearing deposits
2,643
3,306
Foreign interest-bearing deposits:
Banks located in foreign countries
444 (252) 192
631 149 780
Governments and official institutions
179 47 226
169 179 348
Time, savings and other
153 399 552
145 409 554
Total foreign interest-bearing deposits
970
1,682
Total interest-bearing deposits
3,613
4,988
Federal funds purchased, securities sold under agreements to repurchase and other short-term
borrowings
679 1,456 2,135
3,021 5,204 8,225
Trading account liabilities
735 69 804
288 (12) 276
Long-term debt
2,155 170 2,325
1,464 1,152 2,616
Total interest expense
8,877
16,105
Net increase in net interest income (2)
$ 367
$ 4,246
(1) The changes for each category of interest income and expense are divided between the portion of change attributable to the variance in volume and the portion of change attributable to the variance in rate for that category.
The unallocated change in rate or volume variance has been allocated between the rate and volume variances.
(2) Interest income (FTE basis) in 2006 does not include the cumulative tax charge resulting from a change in tax legislation relating to extraterritorial tax income and foreign sales corporation regimes. The FTE impact to net
interest income of this retroactive tax adjustment is a reduction of $270 million from 2005 to 2006. Management has excluded this one-time impact to provide a more comparative basis of presentation for net interest
income and net interest yield on earning assets on a FTE basis. The impact on any given future period is not expected to be material.
Bank of America 2007
99