Bank of America 2007 Annual Report Download - page 90
Download and view the complete annual report
Please find page 90 of the 2007 Bank of America annual report below. You can navigate through the pages in the report by either clicking on the pages listed below, or by using the keyword search tool below to find specific information within the annual report.-
 1
1 -
2
-
3
-
4
-
5
-
6
-
7
-
8
-
9
-
10
-
11
-
12
-
13
-
14
-
15
-
16
-
17
-
18
-
19
-
20
-
21
-
22
-
23
-
24
-
25
-
26
-
27
-
28
-
29
-
30
-
31
-
32
-
33
-
34
-
35
-
36
-
37
-
38
-
39
-
40
-
41
-
42
-
43
-
44
-
45
-
46
-
47
-
48
-
49
-
50
-
51
-
52
-
53
-
54
-
55
-
56
-
57
-
58
-
59
-
60
-
61
-
62
-
63
-
64
-
65
-
66
-
67
-
68
-
69
-
70
-
71
-
72
-
73
-
74
-
75
-
76
-
77
-
78
-
79
-
 80
80 -
 81
81 -
 82
82 -
 83
83 -
 84
84 -
 85
85 -
 86
86 -
 87
87 -
 88
88 -
 89
89 -
 90
90 -
 91
91 -
 92
92 -
 93
93 -
 94
94 -
 95
95 -
 96
96 -
 97
97 -
 98
98 -
 99
99 -
 100
100 -
101
-
102
-
103
-
104
-
105
-
106
-
107
-
108
-
109
-
110
-
111
-
112
-
113
-
114
-
115
-
116
-
117
-
118
-
119
-
120
-
121
-
122
-
123
-
124
-
125
-
126
-
127
-
128
-
129
-
130
-
131
-
132
-
133
-
134
-
135
-
136
-
137
-
138
-
139
-
140
-
141
-
142
-
143
-
144
-
145
-
146
-
147
-
148
-
149
-
150
-
151
-
152
-
153
-
154
-
155
-
156
-
157
-
158
-
159
-
160
-
161
-
162
-
163
-
164
-
165
-
166
-
167
-
168
-
169
-
170
-
171
-
172
-
173
-
174
-
175
-
176
-
177
-
178
-
179
 |
 |

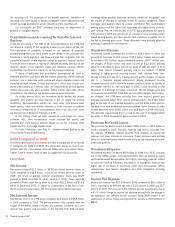
Histogram of Daily Trading-Related Revenue
Twelve Months Ended December 31, 2007
0
10
20
30
40
50
60
70
< -50 -50 to -40 -40 to -30 -30 to -20 -20 to -10 -10 to 0 0 to 10 10 to 20 20 to 30 30 to 40 40 to 50 > 50
Revenue (dollars in millions)
Number of Days
The histogram of daily revenue or loss above is a graphic depiction of
trading volatility and illustrates the daily level of trading-related revenue for
the twelve months ended December 31, 2007. During the twelve months
ended December 31, 2007, positive trading-related revenue was recorded
for 71 percent of the trading days. During the second half of 2007, CDO-
related markets experienced significant liquidity constraints impacting the
availability and reliability of transparent pricing resulting in the valuation of
CDOs becoming more complex and time consuming. Accordingly, it was
not possible to mark these positions to market on a daily basis. As a
result, we recorded valuation adjustments in trading account profits
(losses) of approximately $4.0 billion on certain discrete dates relating to
our super senior CDO exposure. For further discussion of our super senior
CDO exposure and related losses see page 53. Excluding the discrete
writedowns on our super senior CDO exposure, 21 percent of the total
trading days had losses greater than $10 million, and the largest loss was
$159 million. This can be compared to the twelve months ended
December 31, 2006, where positive trading-related revenue was recorded
for 96 percent of the trading days and there were no losses greater than
$10 million, and the largest loss was $10 million. The increase in the
total trading days with losses greater than $10 million was due to the
period of market disruption during the second half of 2007.
To evaluate risk in our trading activities, we focus on the actual and
potential volatility of individual positions as well as portfolios. VAR is a key
statistic used to measure market risk. In order to manage day-to-day risks,
VAR is subject to trading limits both for our overall trading portfolio and
within individual businesses. All limit excesses are communicated to
management for review.
A VAR model simulates the value of a portfolio under a range of hypo-
thetical scenarios in order to generate a distribution of potential gains and
losses. The VAR represents the worst loss the portfolio is expected to
experience based on historical trends with a given level of confidence. VAR
depends on the volatility of the positions in the portfolio and on how
strongly their risks are correlated. Within any VAR model, there are sig-
nificant and numerous assumptions that will differ from company to com-
pany. In addition, the accuracy of a VAR model depends on the availability
and quality of historical data for each of the positions in the portfolio. A
VAR model may require additional modeling assumptions for new products
which do not have extensive historical price data, or for illiquid positions
for which accurate daily prices are not consistently available. Our VAR
model uses a historical simulation approach based on three years of his-
torical data and assumes a 99 percent confidence level. Statistically, this
means that losses will exceed VAR, on average, one out of 100 trading
days, or two to three times each year.
A VAR model is an effective tool in estimating ranges of potential
gains and losses on our trading portfolios. There are however many limi-
tations inherent in a VAR model as it utilizes historical results over a
defined time period to estimate future performance. Historical results may
not always be indicative of future results and changes in market con-
ditions or in the composition of the underlying portfolio could have a mate-
rial impact on the accuracy of the VAR model. This was of particular
relevance in the last part of 2007 when markets experienced a period of
extreme illiquidity resulting in losses that were far outside of the normal
loss forecasts by VAR models. Due to these limitations, we have histor-
ically used the VAR model as only one of the components in managing our
trading risk and also use other techniques such as stress testing and
desk level limits. Periods of extreme market stress influence the reliability
of these techniques to various degrees. See discussion on stress testing
on the following page.
On a quarterly basis, the accuracy of the VAR methodology is
reviewed by backtesting (i.e., comparing actual results against expect-
ations derived from historical data) the VAR results against the daily profit
and loss. Graphic representation of the backtesting results with additional
explanation of backtesting excesses are reported to the GRC. Backtesting
excesses occur when trading losses exceed the VAR. Senior management
reviews and evaluates the results of these tests.
88
Bank of America 2007