Bank of America 2007 Annual Report Download - page 83
Download and view the complete annual report
Please find page 83 of the 2007 Bank of America annual report below. You can navigate through the pages in the report by either clicking on the pages listed below, or by using the keyword search tool below to find specific information within the annual report.-
 1
1 -
2
-
3
-
4
-
5
-
6
-
7
-
8
-
9
-
10
-
11
-
12
-
13
-
14
-
15
-
16
-
17
-
18
-
19
-
20
-
21
-
22
-
23
-
24
-
25
-
26
-
27
-
28
-
29
-
30
-
31
-
32
-
33
-
34
-
35
-
36
-
37
-
38
-
39
-
40
-
41
-
42
-
43
-
44
-
45
-
46
-
47
-
48
-
49
-
50
-
51
-
52
-
53
-
54
-
55
-
56
-
57
-
58
-
59
-
60
-
61
-
62
-
63
-
64
-
65
-
66
-
67
-
68
-
69
-
70
-
71
-
72
-
 73
73 -
 74
74 -
 75
75 -
 76
76 -
 77
77 -
 78
78 -
 79
79 -
 80
80 -
 81
81 -
 82
82 -
 83
83 -
 84
84 -
 85
85 -
 86
86 -
 87
87 -
 88
88 -
 89
89 -
 90
90 -
 91
91 -
 92
92 -
 93
93 -
94
-
95
-
96
-
97
-
98
-
99
-
100
-
101
-
102
-
103
-
104
-
105
-
106
-
107
-
108
-
109
-
110
-
111
-
112
-
113
-
114
-
115
-
116
-
117
-
118
-
119
-
120
-
121
-
122
-
123
-
124
-
125
-
126
-
127
-
128
-
129
-
130
-
131
-
132
-
133
-
134
-
135
-
136
-
137
-
138
-
139
-
140
-
141
-
142
-
143
-
144
-
145
-
146
-
147
-
148
-
149
-
150
-
151
-
152
-
153
-
154
-
155
-
156
-
157
-
158
-
159
-
160
-
161
-
162
-
163
-
164
-
165
-
166
-
167
-
168
-
169
-
170
-
171
-
172
-
173
-
174
-
175
-
176
-
177
-
178
-
179
 |
 |

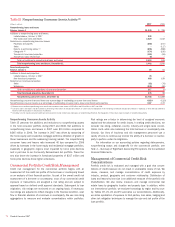
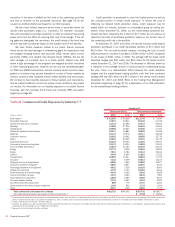
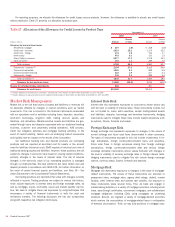
Tables 22 and 23 present the maturity profiles and the credit exposure debt ratings of the net credit default protection portfolio at December 31, 2007
and 2006.
Table 22 Net Credit Default Protection by Maturity Profile
December 31
2007 2006
Less than or equal to one year
2%
7%
Greater than one year and less than or equal to five years
67
46
Greater than five years
31
47
Total net credit default protection
100%
100%
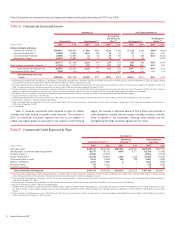
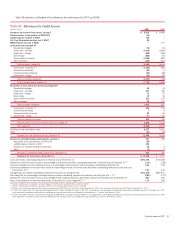
Table 23 Net Credit Default Protection by Credit Exposure Debt Rating (1)
December 31
(Dollars in millions) 2007 2006
Ratings Net Notional Percent Net Notional Percent
AAA
$ (13) 0.2%
$ (23) 0.3%
AA
(92) 1.3
(237) 2.9
A
(2,408) 33.7
(2,598) 31.5
BBB
(3,328) 46.6
(3,968) 48.0
BB
(1,524) 21.3
(1,341) 16.2
B
(180) 2.5
(334) 4.0
CCC and below
(75) 1.0
(50) 0.6
NR
(2)
474 (6.6)
291 (3.5)
Total net credit default protection
$(7,146)
100.0% $(8,260) 100.0%
(1) In order to mitigate the cost of purchasing credit protection, credit exposure can be added by selling credit protection. The distribution of debt rating for net notional credit default protection purchased is shown as a negative
and the net notional credit protection sold is shown as a positive amount.
(2) In addition to unrated names, “NR” includes $550 million and $302 million in net credit default swaps index positions at December 31, 2007 and 2006. While index positions are principally investment grade, credit default
swaps indices include names in and across each of the ratings categories.
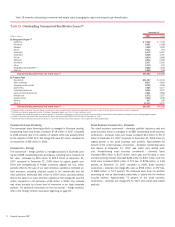
Foreign Portfolio
Our foreign credit and trading portfolio is subject to country risk. We define
country risk as the risk of loss from unfavorable economic and political
developments, currency fluctuations, social instability and changes in
government policies. A risk management framework is in place to meas-
ure, monitor and manage foreign risk and exposures. Management over-
sight of country risk including cross-border risk is provided by the Country
Risk Committee.
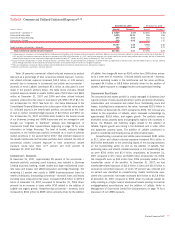
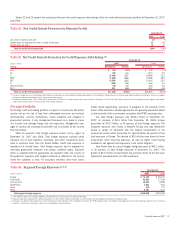
Table 24 presents total foreign exposure broken out by region at
December 31, 2007 and 2006. Total foreign exposure includes credit
exposure net of local liabilities, securities, and other investments domi-
ciled in countries other than the United States. Credit card exposure is
reported on a funded basis. Total foreign exposure can be adjusted for
externally guaranteed exposure and certain collateral types. Exposure
which is assigned external guarantees are reported under the country of
the guarantor. Exposure with tangible collateral is reflected in the country
where the collateral is held. For securities received, other than cross-
border resale agreements, exposure is assigned to the domicile of the
issuer of the securities. Resale agreements are generally presented based
on the domicile of the counterparty consistent with FFIEC reporting rules.
Our total foreign exposure was $138.1 billion at December 31,
2007, an increase of $8.1 billion from December 31, 2006. Europe
accounted for $74.7 billion, or 54 percent, of total foreign exposure. The
European exposure was mostly in Western Europe and was distributed
across a variety of industries with the largest concentration in the
commercial sector which accounted for approximately 46 percent of the
total exposure in Europe. The decline of $10.6 billion was driven by lower
cross-border other financing exposure, as well as higher local funding
available to net against local exposures in the United Kingdom.
Asia Pacific was our second largest foreign exposure at $42.1 billion,
or 30 percent, of total foreign exposure at December 31, 2007. The
growth of $14.7 billion in Asia Pacific was primarily driven by the fair value
adjustment associated with our CCB investment.
Table 24 Regional Foreign Exposure (1, 2, 3)
December 31
(Dollars in millions) 2007 2006
Europe
$ 74,725
$ 85,279
Asia Pacific
42,081
27,403
Latin America
10,944
8,998
Middle East
1,481
811
Africa
470
317
Other
8,361
7,131
Total regional foreign exposure
$138,062
$129,939
(1) In the balances above, local funding or liabilities are subtracted from local exposures as allowed by the FFIEC.
(2) Exposures have been reduced by $6.3 billion at December 31, 2007 and $4.3 billion at December 31, 2006 related to the cash applied as collateral to derivative assets.
(3) Generally, cross-border resale agreements are presented based on the domicile of the counterparty consistent with FFIEC reporting rules. Cross-border resale agreements where the underlying securities are U.S. Treasury
securities, in which case the domicile is the U.S., are excluded from this presentation.
Bank of America 2007
81