Bank of America 2007 Annual Report Download - page 176
Download and view the complete annual report
Please find page 176 of the 2007 Bank of America annual report below. You can navigate through the pages in the report by either clicking on the pages listed below, or by using the keyword search tool below to find specific information within the annual report.-
 1
1 -
2
-
3
-
4
-
5
-
6
-
7
-
8
-
9
-
10
-
11
-
12
-
13
-
14
-
15
-
16
-
17
-
18
-
19
-
20
-
21
-
22
-
23
-
24
-
25
-
26
-
27
-
28
-
29
-
30
-
31
-
32
-
33
-
34
-
35
-
36
-
37
-
38
-
39
-
40
-
41
-
42
-
43
-
44
-
45
-
46
-
47
-
48
-
49
-
50
-
51
-
52
-
53
-
54
-
55
-
56
-
57
-
58
-
59
-
60
-
61
-
62
-
63
-
64
-
65
-
66
-
67
-
68
-
69
-
70
-
71
-
72
-
73
-
74
-
75
-
76
-
77
-
78
-
79
-
80
-
81
-
82
-
83
-
84
-
85
-
86
-
87
-
88
-
89
-
90
-
91
-
92
-
93
-
94
-
95
-
96
-
97
-
98
-
99
-
100
-
101
-
102
-
103
-
104
-
105
-
106
-
107
-
108
-
109
-
110
-
111
-
112
-
113
-
114
-
115
-
116
-
117
-
118
-
119
-
120
-
121
-
122
-
123
-
124
-
125
-
126
-
127
-
128
-
129
-
130
-
131
-
132
-
133
-
134
-
135
-
136
-
137
-
138
-
139
-
140
-
141
-
142
-
143
-
144
-
145
-
146
-
147
-
148
-
149
-
150
-
151
-
152
-
153
-
154
-
155
-
156
-
157
-
158
-
159
-
160
-
161
-
162
-
163
-
164
-
165
-
 166
166 -
 167
167 -
 168
168 -
 169
169 -
 170
170 -
 171
171 -
 172
172 -
 173
173 -
 174
174 -
 175
175 -
 176
176 -
 177
177 -
 178
178 -
 179
179
 |
 |

Condensed Statement of Cash Flows
Year Ended December 31
(Dollars in millions)
2007
2006 2005
Operating activities
Net income
$ 14,982
$ 21,133 $ 16,465
Reconciliation of net income to net cash provided by operating activities:
Equity in undistributed (earnings) losses of subsidiaries
4,247
(6,598) (7,390)
Other operating activities, net
(276)
2,159 (1,035)
Net cash provided by operating activities
18,953
16,694 8,040
Investing activities
Net (purchases) sales of securities
(839)
(705) 403
Net payments to subsidiaries
(44,457)
(13,673) (3,145)
Other investing activities, net
(824)
(1,300) (3,001)
Net cash used in investing activities
(46,120)
(15,678) (5,743)
Financing activities
Net increase (decrease) in commercial paper and other short-term borrowings
8,873
12,519 (292)
Proceeds from issuance of long-term debt
38,730
28,412 20,477
Retirement of long-term debt
(12,056)
(15,506) (11,053)
Proceeds from issuance of preferred stock
1,558
2,850 –
Redemption of preferred stock
–
(270) –
Proceeds from issuance of common stock
1,118
3,117 2,846
Common stock repurchased
(3,790)
(14,359) (5,765)
Cash dividends paid
(10,878)
(9,661) (7,683)
Other financing activities, net
576
(2,799) 1,705
Net cash provided by financing activities
24,131
4,303 235
Net increase (decrease) in cash held at bank subsidiaries
(3,036)
5,319 2,532
Cash held at bank subsidiaries at January 1
54,989
49,670 47,138
Cash held at bank subsidiaries at December 31
$ 51,953
$ 54,989 $ 49,670
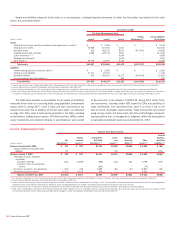
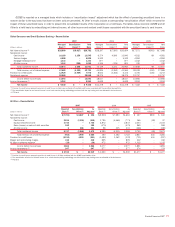
Note 24 – Performance by Geographical Area
Since the Corporation’s operations are highly integrated, certain asset, liability, income and expense amounts must be allocated to arrive at total assets,
total revenue, net of interest expense, income before income taxes and net income by geographic area. The Corporation identifies its geographic perform-
ance based upon the business unit structure used to manage the capital or expense deployed in the region as applicable. This requires certain judgments
related to the allocation of revenue so that revenue can be appropriately matched with the related expense or capital deployed in the region.
At December 31 Year Ended December 31
(Dollars in millions) Year Total Assets
(1)
Total
Revenue, Net
of Interest
Expense
(2)
Income
Before
Income Taxes Net Income
Domestic
(3)
2007 $1,529,899 $59,731 $18,039 $13,137
2006 1,312,912 64,381 28,041 18,605
2005 52,944 21,880 14,778
Asia
2007 46,359 1,613 1,146 721
2006 32,886 1,117 637 420
2005 909 521 344
Europe, Middle East and Africa
2007 129,303 4,097 894 592
2006 100,928 4,835 1,843 1,193
2005 1,783 920 603
Latin America and the Caribbean
2007 10,185 878 845 532
2006 13,011 2,247 1,452 915
2005 1,539 1,159 740
Total Foreign
2007 185,847 6,588 2,885 1,845
2006 146,825 8,199 3,932 2,528
2005 4,231 2,600 1,687
Total Consolidated
2007 $1,715,746 $66,319 $20,924 $14,982
2006 1,459,737 72,580 31,973 21,133
2005 57,175 24,480 16,465
(1) Total assets include long-lived assets, which are primarily located in the U.S.
(2) There were no material intercompany revenues between geographic regions for any of the periods presented.
(3) Includes the Corporation’s Canadian operations, which had total assets of $10.9 billion and $6.8 billion at December 31, 2007 and 2006; total revenue, net of interest expense of $770 million, $636 million and $118
million; income before income taxes of $292 million, $269 million and $73 million; and net income of $195 million, $182 million and $61 million for the years ended December 31, 2007, 2006 and 2005, respectively.
174
Bank of America 2007