Bank of America 2007 Annual Report Download - page 105
Download and view the complete annual report
Please find page 105 of the 2007 Bank of America annual report below. You can navigate through the pages in the report by either clicking on the pages listed below, or by using the keyword search tool below to find specific information within the annual report.-
 1
1 -
2
-
3
-
4
-
5
-
6
-
7
-
8
-
9
-
10
-
11
-
12
-
13
-
14
-
15
-
16
-
17
-
18
-
19
-
20
-
21
-
22
-
23
-
24
-
25
-
26
-
27
-
28
-
29
-
30
-
31
-
32
-
33
-
34
-
35
-
36
-
37
-
38
-
39
-
40
-
41
-
42
-
43
-
44
-
45
-
46
-
47
-
48
-
49
-
50
-
51
-
52
-
53
-
54
-
55
-
56
-
57
-
58
-
59
-
60
-
61
-
62
-
63
-
64
-
65
-
66
-
67
-
68
-
69
-
70
-
71
-
72
-
73
-
74
-
75
-
76
-
77
-
78
-
79
-
80
-
81
-
82
-
83
-
84
-
85
-
86
-
87
-
88
-
89
-
90
-
91
-
92
-
93
-
94
-
 95
95 -
 96
96 -
 97
97 -
 98
98 -
 99
99 -
 100
100 -
 101
101 -
 102
102 -
 103
103 -
 104
104 -
 105
105 -
 106
106 -
 107
107 -
 108
108 -
 109
109 -
 110
110 -
 111
111 -
 112
112 -
 113
113 -
 114
114 -
 115
115 -
116
-
117
-
118
-
119
-
120
-
121
-
122
-
123
-
124
-
125
-
126
-
127
-
128
-
129
-
130
-
131
-
132
-
133
-
134
-
135
-
136
-
137
-
138
-
139
-
140
-
141
-
142
-
143
-
144
-
145
-
146
-
147
-
148
-
149
-
150
-
151
-
152
-
153
-
154
-
155
-
156
-
157
-
158
-
159
-
160
-
161
-
162
-
163
-
164
-
165
-
166
-
167
-
168
-
169
-
170
-
171
-
172
-
173
-
174
-
175
-
176
-
177
-
178
-
179
 |
 |

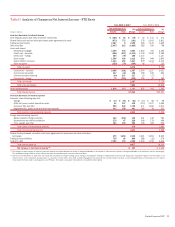
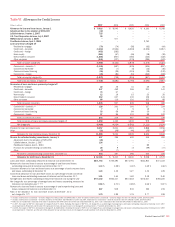
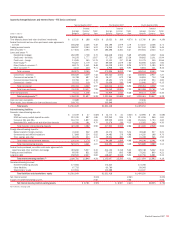
Table VI Allowance for Credit Losses
(Dollars in millions) 2007 2006 2005 2004 2003
Allowance for loan and lease losses, January 1
$ 9,016
$ 8,045 $ 8,626 $ 6,163 $ 6,358
Adjustment due to the adoption of SFAS 159
(32)
––––
LaSalle balance, October 1, 2007
725
––––
U.S. Trust Corporation balance, July 1, 2007
25
––––
MBNA balance, January 1, 2006
–
577 – – –
FleetBoston balance, April 1, 2004
–
– – 2,763 –
Loans and leases charged off
Residential mortgage
(79)
(74) (58) (62) (64)
Credit card – domestic
(3,410)
(3,546) (4,018) (2,536) (1,657)
Credit card – foreign
(452)
(292) – – –
Home equity
(286)
(67) (46) (38) (38)
Direct/Indirect consumer
(1,885)
(857) (380) (344) (322)
Other consumer
(346)
(327) (376) (295) (343)
Total consumer charge-offs
(6,458)
(5,163) (4,878) (3,275) (2,424)
Commercial – domestic
(1)
(1,135)
(597) (535) (504) (857)
Commercial real estate
(54)
(7) (5) (12) (46)
Commercial lease financing
(55)
(28) (315) (39) (132)
Commercial – foreign
(28)
(86) (61) (262) (408)
Total commercial charge-offs
(1,272)
(718) (916) (817) (1,443)
Total loans and leases charged off
(7,730)
(5,881) (5,794) (4,092) (3,867)
Recoveries of loans and leases previously charged off
Residential mortgage
22
35 31 26 24
Credit card – domestic
347
452 366 231 143
Credit card – foreign
74
67–––
Home equity
12
16 15 23 26
Direct/Indirect consumer
512
247 132 136 141
Other consumer
68
110 101 102 88
Total consumer recoveries
1,035
927 645 518 422
Commercial – domestic
(2)
128
261 365 327 224
Commercial real estate
7
4 5 15 5
Commercial lease financing
53
56 84 30 8
Commercial – foreign
27
94 133 89 102
Total commercial recoveries
215
415 587 461 339
Total recoveries of loans and leases previously charged off
1,250
1,342 1,232 979 761
Net charge-offs
(6,480)
(4,539) (4,562) (3,113) (3,106)
Provision for loan and lease losses
8,357
5,001 4,021 2,868 2,916
Other
(23)
(68) (40) (55) (5)
Allowance for loan and lease losses, December 31
11,588
9,016 8,045 8,626 6,163
Reserve for unfunded lending commitments, January 1
397
395 402 416 493
Adjustment due to the adoption of SFAS 159
(28)
––––
LaSalle balance, October 1, 2007
124
––––
FleetBoston balance, April 1, 2004
–
– – 85 –
Provision for unfunded lending commitments
28
9 (7) (99) (77)
Other
(3)
(7) – – –
Reserve for unfunded lending commitments, December 31
518
397 395 402 416
Allowance for credit losses, December 31
$ 12,106
$ 9,413 $ 8,440 $ 9,028 $ 6,579
Loans and leases outstanding measured at historical cost at December 31
$871,754
$706,490 $573,791 $521,813 $371,433
Allowance for loan and lease losses as a percentage of total loans and leases
outstanding measured at historical cost at December 31
(3)
1.33 %
1.28 % 1.40 % 1.65 % 1.66 %
Consumer allowance for loan and lease losses as a percentage of total consumer loans
and leases outstanding at December 31
1.23
1.19 1.27 1.34 1.25
Commercial allowance for loan and lease losses as a percentage of total commercial
loans and leases outstanding measured at historical cost at December 31
(3)
1.51
1.44 1.62 2.19 2.40
Average loans and leases outstanding measured at historical cost during the year
$773,142
$652,417 $537,218 $472,617 $356,220
Net charge-offs as a percentage of average loans and leases outstanding measured at
historical cost during the year
(3, 4, 5)
0.84 %
0.70 % 0.85 % 0.66 % 0.87 %
Allowance for loan and lease losses as a percentage of total nonperforming loans and
leases measured at historical cost at December 31
207
505 532 390 215
Ratio of the allowance for loan and lease losses at December 31 to
net charge-offs (4, 5)
1.79
1.99 1.76 2.77 1.98
(1) Includes small business commercial – domestic charge offs of $911 million and $409 million in 2007 and 2006. Small business commercial – domestic charge offs were not material in 2005, 2004 and 2003.
(2) Includes small business commercial – domestic recoveries of $42 million and $48 million in 2007 and 2006. Small business commercial – domestic recoveries were not material in 2005, 2004 and 2003.
(3) Ratios do not include loans measured at fair value in accordance with SFAS 159 at and for the year ended December 31, 2007. Loans measured at fair value were $4.59 billion at December 31, 2007.
(4) In 2007, the impact of SOP 03-3 decreased net charge-offs by $75 million. Excluding the impact of SOP 03-3, net charge-offs as a percentage of average loans and leases outstanding measured at historical cost in 2007
would have been 0.85 percent and the ratio of the allowance for loan and lease losses to net charge-offs would have been 1.77 percent at December 31, 2007.
(5) In 2006, the impact of SOP 03-3 decreased net charge-offs by $288 million. Excluding the impact of SOP 03-3, net charge-offs as a percentage of average loans and leases outstanding measured at historical cost in 2006
would have been 0.74 percent, and the ratio of the allowance for loan and lease losses to net charge-offs would have been 1.87 percent at December 31, 2006.
Bank of America 2007
103