Bank of America 2007 Annual Report Download - page 158
Download and view the complete annual report
Please find page 158 of the 2007 Bank of America annual report below. You can navigate through the pages in the report by either clicking on the pages listed below, or by using the keyword search tool below to find specific information within the annual report.-
 1
1 -
2
-
3
-
4
-
5
-
6
-
7
-
8
-
9
-
10
-
11
-
12
-
13
-
14
-
15
-
16
-
17
-
18
-
19
-
20
-
21
-
22
-
23
-
24
-
25
-
26
-
27
-
28
-
29
-
30
-
31
-
32
-
33
-
34
-
35
-
36
-
37
-
38
-
39
-
40
-
41
-
42
-
43
-
44
-
45
-
46
-
47
-
48
-
49
-
50
-
51
-
52
-
53
-
54
-
55
-
56
-
57
-
58
-
59
-
60
-
61
-
62
-
63
-
64
-
65
-
66
-
67
-
68
-
69
-
70
-
71
-
72
-
73
-
74
-
75
-
76
-
77
-
78
-
79
-
80
-
81
-
82
-
83
-
84
-
85
-
86
-
87
-
88
-
89
-
90
-
91
-
92
-
93
-
94
-
95
-
96
-
97
-
98
-
99
-
100
-
101
-
102
-
103
-
104
-
105
-
106
-
107
-
108
-
109
-
110
-
111
-
112
-
113
-
114
-
115
-
116
-
117
-
118
-
119
-
120
-
121
-
122
-
123
-
124
-
125
-
126
-
127
-
128
-
129
-
130
-
131
-
132
-
133
-
134
-
135
-
136
-
137
-
138
-
139
-
140
-
141
-
142
-
143
-
144
-
145
-
146
-
147
-
 148
148 -
 149
149 -
 150
150 -
 151
151 -
 152
152 -
 153
153 -
 154
154 -
 155
155 -
 156
156 -
 157
157 -
 158
158 -
 159
159 -
 160
160 -
 161
161 -
 162
162 -
 163
163 -
 164
164 -
 165
165 -
 166
166 -
 167
167 -
 168
168 -
169
-
170
-
171
-
172
-
173
-
174
-
175
-
176
-
177
-
178
-
179
 |
 |

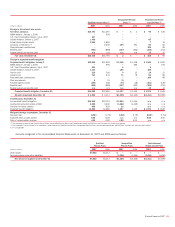
Net periodic benefit cost (income) for 2007, 2006 and 2005 included the following components:
Qualified Pension Plans Nonqualified Pension Plans
Postretirement Health
and Life Plans
(Dollars in millions) 2007 2006 2005 2007 2006 2005 2007 2006 2005
Components of net periodic benefit cost (income)
Service cost
$ 316
$ 306 $ 261
$9
$13 $11
$16
$13 $11
Interest cost
761
676 643
71
78 61
84
86 78
Expected return on plan assets
(1,312)
(1,034) (983)
–
––
(8)
(10) (14)
Amortization of transition obligation
–
––
–
––
32
31 31
Amortization of prior service cost (credits)
47
41 44
(7)
(8) (8)
–
––
Recognized net actuarial (gain) loss
156
229 182
17
20 24
(60)
12 80
Recognized loss (gain) due to settlements and curtailments
–
––
14
–9
(2)
––
Net periodic benefit cost (income)
$ (32)
$ 218 $ 147
$ 104
$ 103 $ 97
$62
$ 132 $ 186
Weighted average assumptions used to determine net cost for
years ended December 31
Discount rate
(1)
5.75%
5.50% 5.75%
5.75%
5.50% 5.75%
5.75%
5.50% 5.75%
Expected return on plan assets
8.00
8.00 8.50
n/a
n/a n/a
8.00
8.00 8.50
Rate of compensation increase
4.00
4.00 4.00
4.00
4.00 4.00
n/a
n/a n/a
(1) In connection with the U.S. Trust Corporation and LaSalle mergers, those plans were remeasured on July 1, 2007 and October 1, 2007, using a discount rate of 6.15 percent and 6.50 percent.
n/a = not applicable
Net periodic postretirement health and life expense was determined
using the “projected unit credit” actuarial method. Gains and losses for all
benefits except postretirement health care are recognized in accordance
with the standard amortization provisions of the applicable accounting
standards. For the Postretirement Health Care Plans, 50 percent of the
unrecognized gain or loss at the beginning of the fiscal year (or at sub-
sequent remeasurement) is recognized on a level basis during the year.
Assumed health care cost trend rates affect the postretirement bene-
fit obligation and benefit cost reported for the Postretirement Health Care
Plans. The assumed health care cost trend rate used to measure the
expected cost of benefits covered by the Postretirement Health Care Plans
was 9.0 percent for 2008, reducing in steps to 5.0 percent in 2013 and
later years. A one-percentage-point increase in assumed health care cost
trend rates would have increased the service and interest costs and the
benefit obligation by $5 million and $64 million in 2007, and $3 million
and $51 million in both 2006 and 2005. A one-percentage-point decrease
in assumed health care cost trend rates would have lowered the service
and interest costs and the benefit obligation by $4 million and $54 million
in 2007, $3 million and $44 million in 2006, and $3 million and $43 mil-
lion in 2005.
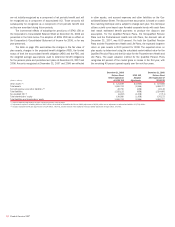
Pre-tax amounts included in accumulated OCI at December 31, 2007 and 2006 were as follows:
Qualified
Pension Plans
Nonqualified
Pension Plans
Postretirement
Health and
Life Plans Total
(Dollars in millions) 2007 2006 2007 2006 2007 2006 2007 2006
Net actuarial (gain) loss
$1,776
$1,765
$119
$224
$(106)
$ (68)
$1,789
$1,921
Transition obligation
–
–
–
–
157
189
157
189
Prior service cost (credits)
157
201
(38)
(44)
–
–
119
157
Amounts recognized in accumulated OCI
$1,933
$1,966
$81
$180
$51
$121
$2,065
$2,267
156
Bank of America 2007