Bank of America 2007 Annual Report Download - page 49
Download and view the complete annual report
Please find page 49 of the 2007 Bank of America annual report below. You can navigate through the pages in the report by either clicking on the pages listed below, or by using the keyword search tool below to find specific information within the annual report.-
 1
1 -
2
-
3
-
4
-
5
-
6
-
7
-
8
-
9
-
10
-
11
-
12
-
13
-
14
-
15
-
16
-
17
-
18
-
19
-
20
-
21
-
22
-
23
-
24
-
25
-
26
-
27
-
28
-
29
-
30
-
31
-
32
-
33
-
34
-
35
-
36
-
37
-
38
-
 39
39 -
 40
40 -
 41
41 -
 42
42 -
 43
43 -
 44
44 -
 45
45 -
 46
46 -
 47
47 -
 48
48 -
 49
49 -
 50
50 -
 51
51 -
 52
52 -
 53
53 -
 54
54 -
 55
55 -
 56
56 -
 57
57 -
 58
58 -
 59
59 -
60
-
61
-
62
-
63
-
64
-
65
-
66
-
67
-
68
-
69
-
70
-
71
-
72
-
73
-
74
-
75
-
76
-
77
-
78
-
79
-
80
-
81
-
82
-
83
-
84
-
85
-
86
-
87
-
88
-
89
-
90
-
91
-
92
-
93
-
94
-
95
-
96
-
97
-
98
-
99
-
100
-
101
-
102
-
103
-
104
-
105
-
106
-
107
-
108
-
109
-
110
-
111
-
112
-
113
-
114
-
115
-
116
-
117
-
118
-
119
-
120
-
121
-
122
-
123
-
124
-
125
-
126
-
127
-
128
-
129
-
130
-
131
-
132
-
133
-
134
-
135
-
136
-
137
-
138
-
139
-
140
-
141
-
142
-
143
-
144
-
145
-
146
-
147
-
148
-
149
-
150
-
151
-
152
-
153
-
154
-
155
-
156
-
157
-
158
-
159
-
160
-
161
-
162
-
163
-
164
-
165
-
166
-
167
-
168
-
169
-
170
-
171
-
172
-
173
-
174
-
175
-
176
-
177
-
178
-
179
 |
 |

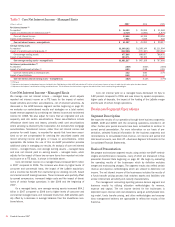
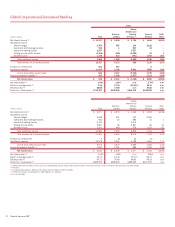
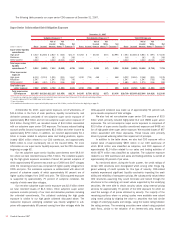
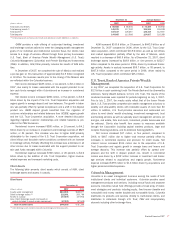
December 31 Average Balance
(Dollars in millions) 2007 2006 2007 2006
Total loans and leases
$359,946
$307,661
$327,810
$288,131
Total earning assets
(1)
383,384
343,338
353,591
344,013
Total assets
(1)
442,987
399,373
408,034
396,559
Total deposits
344,850
329,195
328,918
332,242
(1) Total earning assets and total assets include asset allocations to match liabilities (i.e., deposits).
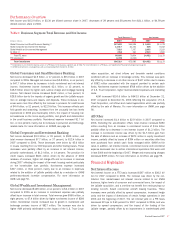
The strategy for GCSBB is to attract, retain and deepen customer
relationships. We achieve this strategy through our ability to offer a wide
range of products and services through a franchise that stretches coast to
coast through 32 states and the District of Columbia. We also provide
credit card products to customers in Canada, Ireland, Spain and the
United Kingdom. In the U.S., we serve approximately 59 million consumer
and small business relationships utilizing our network of 6,149 banking
centers, 18,753 domestic branded ATMs, and telephone and Internet
channels. Within GCSBB, there are three primary businesses: Deposits,
Card Services, and Consumer Real Estate. In addition, ALM/Other
includes the results of ALM activities and other consumer-related busi-
nesses (e.g., insurance). GCSBB, specifically Card Services, is presented
on a managed basis. For a reconciliation of managed GCSBB to held
GCSBB, see Note 22 – Business Segment Information to the Consolidated
Financial Statements.
During 2007, Visa Inc. filed a registration statement with the SEC
with respect to a proposed IPO. Subject to market conditions and other
factors, Visa Inc. expects the IPO to occur in the first half of 2008. We
expect to record a gain associated with the IPO. In addition, we expect
that a portion of the proceeds from the IPO will be used by Visa Inc. to
fund liabilities arising from litigation which would allow us to record an
offset to the litigation liabilities that we recorded in the fourth quarter of
2007 as discussed below.
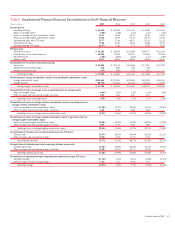
Net income decreased $1.9 billion, or 17 percent, to $9.4 billion
compared to 2006 as increases in noninterest income and net interest
income were more than offset by increases in provision for credit losses
and noninterest expense.
Net interest income increased $612 million, or two percent, to $28.8
billion due to the impacts of organic growth and the LaSalle acquisition on
average loans and leases, and deposits compared to 2006. Noninterest
income increased $2.1 billion, or 13 percent, to $18.9 billion compared to
the same period in 2006, mainly due to increases in card income, service
charges and mortgage banking income.
Provision for credit losses increased $4.4 billion, or 51 percent, to
$12.9 billion compared to 2006. This increase primarily resulted from a
$3.2 billion increase in Card Services and a $978 million increase in
Consumer Real Estate. For further discussion of the increase in provision
for credit losses related to Card Services and Consumer Real Estate, see
their respective discussions.
Noninterest expense increased $1.7 billion, or nine percent, to
$20.1 billion largely due to increases in personnel-related expenses, Visa-
related litigation costs, equally allocated to Card Services and Treasury
Services on a management accounting basis, and technology related
costs. For additional information on Visa-related litigation, see Note 13 –
Commitments and Contingencies to the Consolidated Financial
Statements.
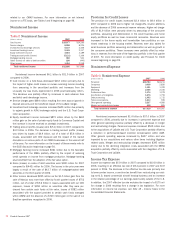
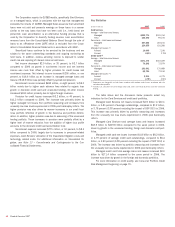
Deposits
Deposits provides a comprehensive range of products to consumers and
small businesses. Our products include traditional savings accounts,
money market savings accounts, CDs and IRAs, and noninterest and
interest-bearing checking accounts. Debit card results are also included in
Deposits.
Deposit products provide a relatively stable source of funding and
liquidity. We earn net interest spread revenues from investing this liquidity
in earning assets through client-facing lending activity and our ALM activ-
ities. The revenue is allocated to the deposit products using our funds
transfer pricing process which takes into account the interest rates and
maturity characteristics of the deposits. Deposits also generate fees such
as account service fees, non-sufficient fund fees, overdraft charges and
ATM fees, while debit cards generate merchant interchange fees based on
purchase volume.
Excluding accounts obtained through acquisitions, we added approx-
imately 2.3 million net new retail checking accounts in 2007. These addi-
tions resulted from continued improvement in sales and service results in
the Banking Center Channel and Online, and the success of such products
as Keep the Change
TM
, Risk Free CDs, Balance Rewards and Affinity.
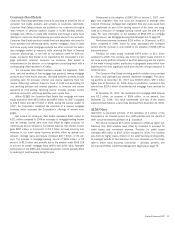
We continue to migrate qualifying affluent customers and their
related deposit balances from GCSBB to GWIM. In 2007, a total of $11.4
billion of deposits were migrated from GCSBB to GWIM compared to $10.7
billion in 2006. After migration, the associated net interest income, serv-
ice charges and noninterest expense are recorded in GWIM.
Net income increased $364 million, or seven percent, to $5.2 billion
compared to 2006 as an increase in noninterest income was partially
offset by an increase in noninterest expense. Net interest income
remained relatively flat at $9.4 billion compared to 2006 as the addition
of LaSalle and higher deposit spreads resulting from disciplined pricing
were offset by the impact of lower balances. Average deposits decreased
$3.2 billion, or one percent, largely due to the migration of customer rela-
tionships and related balances to GWIM, partially offset by the acquisition
of LaSalle. The increase in noninterest income was driven by higher serv-
ice charges of $665 million, or 12 percent, primarily as a result of new
demand deposit account growth and the addition of LaSalle. Additionally,
debit card revenue growth of $248 million, or 13 percent, was due to a
higher number of checking accounts, increased usage, the addition of
LaSalle and market penetration (i.e., increase in the number of existing
account holders with debit cards).
Noninterest expense increased $323 million, or four percent, to $9.1
billion compared to 2006, primarily due to the addition of LaSalle, and to
higher account and transaction volumes.
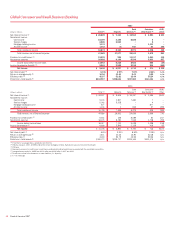
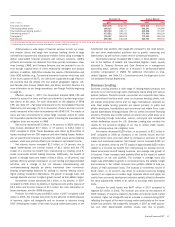
Card Services
Card Services, which excludes the results of debit cards (included in
Deposits), provides a broad offering of products, including U.S. Consumer
and Business Card, Unsecured Lending, and International Card. We offer a
variety of co-branded and affinity credit card products and have become
the leading issuer of credit cards through endorsed marketing in the U.S.
and Europe. During 2007, Merchant Services was transferred to Treasury
Services within GCIB. Previously their results were reported in Card Serv-
ices. Prior period amounts have been reclassified.
Bank of America 2007
47