Bank of America 2007 Annual Report Download - page 50
Download and view the complete annual report
Please find page 50 of the 2007 Bank of America annual report below. You can navigate through the pages in the report by either clicking on the pages listed below, or by using the keyword search tool below to find specific information within the annual report.-
 1
1 -
2
-
3
-
4
-
5
-
6
-
7
-
8
-
9
-
10
-
11
-
12
-
13
-
14
-
15
-
16
-
17
-
18
-
19
-
20
-
21
-
22
-
23
-
24
-
25
-
26
-
27
-
28
-
29
-
30
-
31
-
32
-
33
-
34
-
35
-
36
-
37
-
38
-
39
-
 40
40 -
 41
41 -
 42
42 -
 43
43 -
 44
44 -
 45
45 -
 46
46 -
 47
47 -
 48
48 -
 49
49 -
 50
50 -
 51
51 -
 52
52 -
 53
53 -
 54
54 -
 55
55 -
 56
56 -
 57
57 -
 58
58 -
 59
59 -
 60
60 -
61
-
62
-
63
-
64
-
65
-
66
-
67
-
68
-
69
-
70
-
71
-
72
-
73
-
74
-
75
-
76
-
77
-
78
-
79
-
80
-
81
-
82
-
83
-
84
-
85
-
86
-
87
-
88
-
89
-
90
-
91
-
92
-
93
-
94
-
95
-
96
-
97
-
98
-
99
-
100
-
101
-
102
-
103
-
104
-
105
-
106
-
107
-
108
-
109
-
110
-
111
-
112
-
113
-
114
-
115
-
116
-
117
-
118
-
119
-
120
-
121
-
122
-
123
-
124
-
125
-
126
-
127
-
128
-
129
-
130
-
131
-
132
-
133
-
134
-
135
-
136
-
137
-
138
-
139
-
140
-
141
-
142
-
143
-
144
-
145
-
146
-
147
-
148
-
149
-
150
-
151
-
152
-
153
-
154
-
155
-
156
-
157
-
158
-
159
-
160
-
161
-
162
-
163
-
164
-
165
-
166
-
167
-
168
-
169
-
170
-
171
-
172
-
173
-
174
-
175
-
176
-
177
-
178
-
179
 |
 |

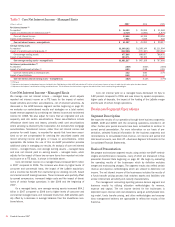
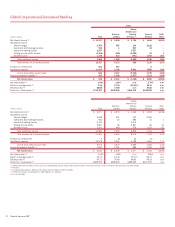
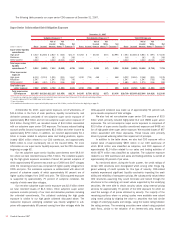
The Corporation reports its GCSBB results, specifically Card Services,
on a managed basis, which is consistent with the way that management
evaluates the results of GCSBB. Managed basis assumes that securitized
loans were not sold and presents earnings on these loans in a manner
similar to the way loans that have not been sold (i.e., held loans) are
presented. Loan securitization is an alternative funding process that is
used by the Corporation to diversify funding sources. Loan securitization
removes loans from the Consolidated Balance Sheet through the sale of
loans to an off-balance sheet QSPE which is excluded from the Corpo-
ration’s Consolidated Financial Statements in accordance with GAAP.
Securitized loans continue to be serviced by the business and are
subject to the same underwriting standards and ongoing monitoring as
held loans. In addition, excess servicing income is exposed to similar
credit risk and repricing of interest rates as held loans.
Net income decreased $2.0 billion, or 35 percent, to $3.7 billion
compared to 2006 as growth in noninterest income and net interest
income was more than offset by higher provision for credit losses and
noninterest expense. Net interest income increased $205 million, or one
percent, to $16.6 billion as an increase in managed average loans and
leases of $18.5 billion was partially offset by spread compression.
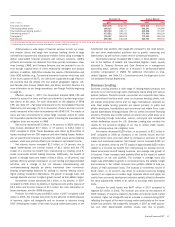
Noninterest income increased $692 million, or eight percent, to $9.0
billion mainly due to higher cash advance fees related to organic loan
growth in domestic credit card and unsecured lending. All other income
increased $124 million primarily due to higher foreign revenues.
Provision for credit losses increased $3.2 billion, or 40 percent, to
$11.3 billion compared to 2006. The increase was primarily driven by
higher managed net losses from portfolio seasoning and increases from
unusually low loss levels experienced in 2006 post bankruptcy reform. The
higher provision was also driven by reserve increases in our small busi-
ness portfolio reflective of growth in the business and portfolio deterio-
ration. In addition, higher provision was due to seasoning of the unsecured
lending portfolio. These increases in provision were partially offset by a
higher level of reserve reduction from the addition of higher loss profile
accounts to the domestic credit card securitization trust.
Noninterest expense increased $775 million, or 10 percent, to $8.3
billion compared to 2006, largely due to increases in personnel-related
expenses, Card Services’ allocation of the Visa-related litigation costs and
technology related costs. For additional information on Visa-related liti-
gation, see Note 13 – Commitments and Contingencies to the Con-
solidated Financial Statements.
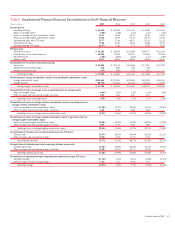
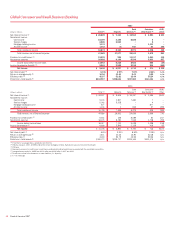
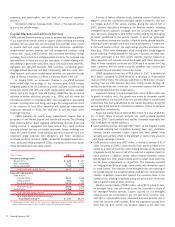
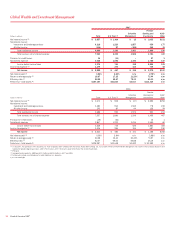
Key Statistics
(Dollars in millions) 2007 2006
Card Services
Average – total loans and leases:
Managed
$209,774
$191,314
Held
106,490
95,076
Period end – total loans and leases:
Managed
227,822
203,151
Held
124,855
101,286
Managed net losses
(1)
:
Amount
10,099
7,236
Percent
4.81%
3.78%
Credit Card (2)
Average – total loans and leases:
Managed
$171,376
$163,409
Held
70,242
72,979
Period end – total loans and leases:
Managed
183,691
170,489
Held
80,724
72,194
Managed net losses
(1)
:
Amount
8,214
6,375
Percent
4.79%
3.90%
(1) Represents net charge-offs on held loans combined with realized credit losses associated with the
securitized loan portfolio.
(2) Includes U.S. consumer card and foreign credit card. Does not include business card and unsecured
lending.
The table above and the discussion below presents select key
indicators for the Card Services and credit card portfolios.
Managed Card Services net losses increased $2.9 billion to $10.1
billion, or 4.81 percent of average outstandings, compared to $7.2 billion,
or 3.78 percent (3.93 percent excluding the impact of SOP 03-3) in 2006.
This increase was primarily driven by portfolio seasoning and increases
from the unusually low loss levels experienced in 2006 post bankruptcy
reform.
Managed Card Services total average loans and leases increased
$18.5 billion to $209.8 billion compared to the same period in 2006,
driven by growth in the unsecured lending, foreign and domestic card port-
folios.
Managed credit card net losses increased $1.8 billion to $8.2 billion,
or 4.79 percent of average credit card outstandings, compared to $6.4
billion, or 3.90 percent (3.99 percent excluding the impact of SOP 03-3) in
2006. The increase was driven by portfolio seasoning and increases from
the unusually low loss levels experienced in 2006 post bankruptcy reform.
Managed credit card total average loans and leases increased $8.0
billion to $171.4 billion compared to the same period in 2006. The
increase was driven by growth in the foreign and domestic portfolios.
For more information on credit quality, see Consumer Portfolio Credit
Risk Management beginning on page 70.
48
Bank of America 2007