Bank of America 2007 Annual Report Download - page 52
Download and view the complete annual report
Please find page 52 of the 2007 Bank of America annual report below. You can navigate through the pages in the report by either clicking on the pages listed below, or by using the keyword search tool below to find specific information within the annual report.-
 1
1 -
2
-
3
-
4
-
5
-
6
-
7
-
8
-
9
-
10
-
11
-
12
-
13
-
14
-
15
-
16
-
17
-
18
-
19
-
20
-
21
-
22
-
23
-
24
-
25
-
26
-
27
-
28
-
29
-
30
-
31
-
32
-
33
-
34
-
35
-
36
-
37
-
38
-
39
-
40
-
41
-
 42
42 -
 43
43 -
 44
44 -
 45
45 -
 46
46 -
 47
47 -
 48
48 -
 49
49 -
 50
50 -
 51
51 -
 52
52 -
 53
53 -
 54
54 -
 55
55 -
 56
56 -
 57
57 -
 58
58 -
 59
59 -
 60
60 -
 61
61 -
 62
62 -
63
-
64
-
65
-
66
-
67
-
68
-
69
-
70
-
71
-
72
-
73
-
74
-
75
-
76
-
77
-
78
-
79
-
80
-
81
-
82
-
83
-
84
-
85
-
86
-
87
-
88
-
89
-
90
-
91
-
92
-
93
-
94
-
95
-
96
-
97
-
98
-
99
-
100
-
101
-
102
-
103
-
104
-
105
-
106
-
107
-
108
-
109
-
110
-
111
-
112
-
113
-
114
-
115
-
116
-
117
-
118
-
119
-
120
-
121
-
122
-
123
-
124
-
125
-
126
-
127
-
128
-
129
-
130
-
131
-
132
-
133
-
134
-
135
-
136
-
137
-
138
-
139
-
140
-
141
-
142
-
143
-
144
-
145
-
146
-
147
-
148
-
149
-
150
-
151
-
152
-
153
-
154
-
155
-
156
-
157
-
158
-
159
-
160
-
161
-
162
-
163
-
164
-
165
-
166
-
167
-
168
-
169
-
170
-
171
-
172
-
173
-
174
-
175
-
176
-
177
-
178
-
179
 |
 |

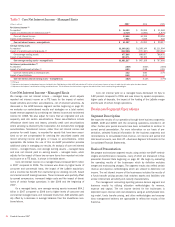
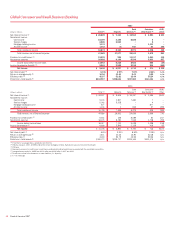
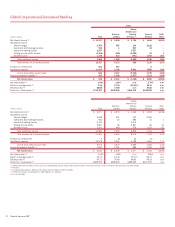
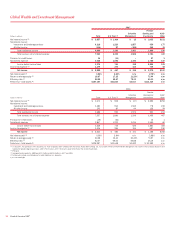
Global Corporate and Investment Banking
2007
(Dollars in millions) Total
Business
Lending
Capital
Markets and
Advisory
Services
(1)
Treasury
Services
ALM/
Other
Net interest income
(2)
$ 11,217 $ 5,020 $ 2,786 $ 3,814 $(403)
Noninterest income:
Service charges
2,769 507 134 2,128 –
Investment and brokerage services
910 1 867 42 –
Investment banking income
2,537 – 2,537 – –
Trading account profits (losses)
(5,164) (180) (5,050) 63 3
All other income
1,148 824 (971) 1,092 203
Total noninterest income
2,200 1,152 (2,483) 3,325 206
Total revenue, net of interest expense
13,417 6,172 303 7,139 (197)
Provision for credit losses
652 647 – 5 –
Noninterest expense
11,925 2,158 5,642 3,856 269
Income (loss) before income taxes
840 3,367 (5,339) 3,278 (466)
Income tax expense (benefit)
(2)
302 1,246 (1,977) 1,213 (180)
Net income (loss)
$ 538 $ 2,121 $ (3,362) $ 2,065 $(286)
Net interest yield
(2)
1.66% 2.00% n/m 2.79% n/m
Return on average equity
(3)
1.19 13.12 (25.41)% 26.31 n/m
Efficiency ratio
(2)
88.88 34.98 n/m 54.02 n/m
Period end – total assets
(4)
$776,107 $305,548 $413,115 $180,369 n/m
2006
(Dollars in millions) Total
Business
Lending
Capital
Markets and
Advisory
Services
Treasury
Services
ALM/
Other
Net interest income
(2)
$ 9,877 $ 4,575 $ 1,660 $ 3,878 $(236)
Noninterest income:
Service charges 2,648 501 121 2,026 –
Investment and brokerage services 942 15 893 33 1
Investment banking income 2,476 – 2,476 – –
Trading account profits 2,967 55 2,847 52 13
All other income 2,251 469 478 1,223 81
Total noninterest income 11,284 1,040 6,815 3,334 95
Total revenue, net of interest expense 21,161 5,615 8,475 7,212 (141)
Provision for credit losses 9 (2) 14 (3) –
Noninterest expense 11,578 2,047 5,799 3,561 171
Income (loss) before income taxes 9,574 3,570 2,662 3,654 (312)
Income tax expense (benefit)
(2)
3,542 1,321 985 1,352 (116)
Net income (loss) $ 6,032 $ 2,249 $ 1,677 $ 2,302 $(196)
Net interest yield
(2)
1.62% 1.98% n/m 2.86% n/m
Return on average equity
(3)
14.33 14.36 15.17% 28.71 n/m
Efficiency ratio
(2)
54.71 36.45 68.42 49.36 n/m
Period end – total assets
(4)
$685,935 $248,225 $385,450 $167,979 n/m
(1) CMAS revenue of $303 million for 2007 consists of market-based revenue of $233 million and $70 million of net interest income on loans for which the fair value option has been elected.
(2) FTE basis
(3) Average allocated equity for GCIB was $45.3 billion and $42.1 billion for 2007 and 2006.
(4) Total assets include asset allocations to match liabilities (i.e., deposits).
n/m = not meaningful
50
Bank of America 2007