Bank of America 2007 Annual Report Download - page 61
Download and view the complete annual report
Please find page 61 of the 2007 Bank of America annual report below. You can navigate through the pages in the report by either clicking on the pages listed below, or by using the keyword search tool below to find specific information within the annual report.-
 1
1 -
2
-
3
-
4
-
5
-
6
-
7
-
8
-
9
-
10
-
11
-
12
-
13
-
14
-
15
-
16
-
17
-
18
-
19
-
20
-
21
-
22
-
23
-
24
-
25
-
26
-
27
-
28
-
29
-
30
-
31
-
32
-
33
-
34
-
35
-
36
-
37
-
38
-
39
-
40
-
41
-
42
-
43
-
44
-
45
-
46
-
47
-
48
-
49
-
50
-
 51
51 -
 52
52 -
 53
53 -
 54
54 -
 55
55 -
 56
56 -
 57
57 -
 58
58 -
 59
59 -
 60
60 -
 61
61 -
 62
62 -
 63
63 -
 64
64 -
 65
65 -
 66
66 -
 67
67 -
 68
68 -
 69
69 -
 70
70 -
 71
71 -
72
-
73
-
74
-
75
-
76
-
77
-
78
-
79
-
80
-
81
-
82
-
83
-
84
-
85
-
86
-
87
-
88
-
89
-
90
-
91
-
92
-
93
-
94
-
95
-
96
-
97
-
98
-
99
-
100
-
101
-
102
-
103
-
104
-
105
-
106
-
107
-
108
-
109
-
110
-
111
-
112
-
113
-
114
-
115
-
116
-
117
-
118
-
119
-
120
-
121
-
122
-
123
-
124
-
125
-
126
-
127
-
128
-
129
-
130
-
131
-
132
-
133
-
134
-
135
-
136
-
137
-
138
-
139
-
140
-
141
-
142
-
143
-
144
-
145
-
146
-
147
-
148
-
149
-
150
-
151
-
152
-
153
-
154
-
155
-
156
-
157
-
158
-
159
-
160
-
161
-
162
-
163
-
164
-
165
-
166
-
167
-
168
-
169
-
170
-
171
-
172
-
173
-
174
-
175
-
176
-
177
-
178
-
179
 |
 |

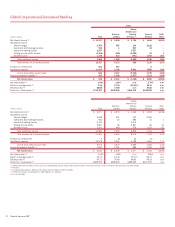
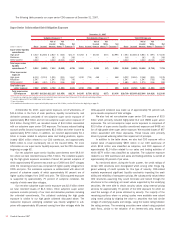
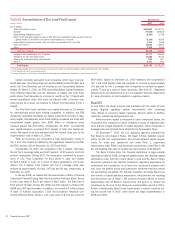
All Other
2007 2006
(Dollars in millions)
Reported
Basis
(1)
Securitization
Offset
(2)
As Adjusted
Reported
Basis
(1)
Securitization
Offset
(2)
As Adjusted
Net interest income
(3)
$(7,701) $ 8,027 $ 326
$(5,930) $ 7,593 $1,663
Noninterest income:
Card income
2,816 (3,356) (540)
3,795 (4,566) (771)
Equity investment income
3,745 – 3,745
2,872 – 2,872
Gains (losses) on sales of debt securities
180 – 180
(475) – (475)
All other income
6 288 294
98 335 433
Total noninterest income
6,747 (3,068) 3,679
6,290 (4,231) 2,059
Total revenue, net of interest expense
(954) 4,959 4,005
360 3,362 3,722
Provision for credit losses
(5,210) 4,959 (251)
(3,494) 3,362 (132)
Merger and restructuring charges
(4)
410 – 410
805 – 805
All other noninterest expense
(20) – (20)
972 – 972
Income before income taxes
3,866 – 3,866
2,077 – 2,077
Income tax expense
(3)
947 – 947
577 – 577
Net income
$ 2,919 $ – $2,919
$ 1,500 $ – $1,500
(1) Provision for credit losses represents the provision for credit losses in All Other combined with the GCSBB securitization offset.
(2) The securitization offset on net interest income is on a funds transfer pricing methodology consistent with the way funding costs are allocated to the businesses.
(3) FTE basis
(4) For more information on merger and restructuring charges, see Note 2 – Merger and Restructuring Activity to the Consolidated Financial Statements.
GCSBB is reported on a managed basis which includes a
“securitization impact” adjustment which has the effect of assuming that
loans that have been securitized were not sold and presenting these loans
in a manner similar to the way loans that have not been sold are pre-
sented. All Other’s results include a corresponding “securitization offset”
which removes the impact of these securitized loans in order to present
the consolidated results on a GAAP basis (i.e., held basis). See the
GCSBB section beginning on page 46 for information on the GCSBB
managed results. The following All Other discussion focuses on the results
on an as adjusted basis excluding the securitization offset. For additional
information, see Note 22 – Business Segment Information to the Con-
solidated Financial Statements.
In addition to the securitization offset discussed above, All Other
includes our Equity Investments businesses and Other.
Equity Investments includes Principal Investing, Corporate Invest-
ments and Strategic Investments. Principal Investing is comprised of a
diversified portfolio of investments in privately-held and publicly-traded
companies at all stages of their life cycle from start-up to buyout. These
investments are made either directly in a company or held through a fund
and are accounted for at fair value. In addition, Principal Investing has
unfunded equity commitments related to some of these investments. For
more information on these commitments, see Note 13 – Commitments
and Contingencies to the Consolidated Financial Statements.
Corporate Investments primarily includes investments in publicly-
traded equity securities and funds which are accounted for as AFS market-
able equity securities. Strategic Investments includes investments of
$16.4 billion in CCB, $2.6 billion in Grupo Financiero Santander, S.A.
(Santander), $2.6 billion Banco Itaú and other investments. Beginning in
the fourth quarter of 2007, the shares of CCB are accounted for as AFS
marketable equity securities and carried at fair value with a corresponding
net-of-tax offset to accumulated OCI. Prior to the fourth quarter of 2007,
these shares were accounted for at cost as they are non-transferable until
October 2008. We also hold an option to increase our ownership interest
in CCB to 19.1 percent. Additional shares received upon exercise of this
option are restricted through August 2011. This option expires in February
2011. The strike price of the option is based on the IPO price that steps
up on an annual basis and is currently at 103 percent of the IPO price. The
strike price of the option is capped at 118 percent of the IPO price depend-
ing when the option is exercised. Our investment in Santander is
accounted for under the equity method of accounting. The restricted
shares of Banco Itaú are currently carried at cost but, similar to CCB, will
be accounted for as AFS marketable equity securities and carried at fair
value with an offset net-of-tax to accumulated OCI beginning in the second
quarter of 2008. Income associated with Equity Investments is recorded in
equity investment income.
Other includes the residual impact of the allowance for credit losses
and the cost allocation processes, merger and restructuring charges,
intersegment eliminations, and the results of certain businesses that are
expected to be or have been sold or are in the process of being liquidated.
Other also includes certain amounts associated with ALM activities, includ-
ing the residual impact of funds transfer pricing allocation methodologies,
amounts associated with the change in the value of derivatives used as
economic hedges of interest rate and foreign exchange rate fluctuations
that do not qualify for SFAS 133 hedge accounting treatment, foreign
exchange rate fluctuations related to SFAS 52 revaluation of foreign
denominated debt issuances, certain gains (losses) on sales of whole
mortgage loans, and gains (losses) on sales of debt securities. Other also
includes adjustments to noninterest income and income tax expense to
remove the FTE impact of items (primarily low-income housing tax credits)
that have been grossed up within noninterest income to a FTE amount in
the business segments.
Net income increased $1.4 billion to $2.9 billion primarily due to an
increase in noninterest income combined with decreases in all other non-
interest expense, merger and restructuring charges and provision for credit
losses partially offset by a decrease in net interest income.
Net interest income decreased $1.3 billion resulting largely from the
absence of net interest income due to the sale of the Latin American
operations and Hong Kong-based retail and commercial banking business
which were included in our 2006 results. Net interest income was also
adversely impacted by the implementation of new accounting guidance
(FSP 13-2) which decreased net interest income by approximately $230
million.
Noninterest income increased $1.6 billion driven by the $1.5 billion
gain from the sale of Marsico. In addition, noninterest income increased
Bank of America 2007
59