Bank of America 2007 Annual Report Download - page 91
Download and view the complete annual report
Please find page 91 of the 2007 Bank of America annual report below. You can navigate through the pages in the report by either clicking on the pages listed below, or by using the keyword search tool below to find specific information within the annual report.-
 1
1 -
2
-
3
-
4
-
5
-
6
-
7
-
8
-
9
-
10
-
11
-
12
-
13
-
14
-
15
-
16
-
17
-
18
-
19
-
20
-
21
-
22
-
23
-
24
-
25
-
26
-
27
-
28
-
29
-
30
-
31
-
32
-
33
-
34
-
35
-
36
-
37
-
38
-
39
-
40
-
41
-
42
-
43
-
44
-
45
-
46
-
47
-
48
-
49
-
50
-
51
-
52
-
53
-
54
-
55
-
56
-
57
-
58
-
59
-
60
-
61
-
62
-
63
-
64
-
65
-
66
-
67
-
68
-
69
-
70
-
71
-
72
-
73
-
74
-
75
-
76
-
77
-
78
-
79
-
80
-
 81
81 -
 82
82 -
 83
83 -
 84
84 -
 85
85 -
 86
86 -
 87
87 -
 88
88 -
 89
89 -
 90
90 -
 91
91 -
 92
92 -
 93
93 -
 94
94 -
 95
95 -
 96
96 -
 97
97 -
 98
98 -
 99
99 -
 100
100 -
 101
101 -
102
-
103
-
104
-
105
-
106
-
107
-
108
-
109
-
110
-
111
-
112
-
113
-
114
-
115
-
116
-
117
-
118
-
119
-
120
-
121
-
122
-
123
-
124
-
125
-
126
-
127
-
128
-
129
-
130
-
131
-
132
-
133
-
134
-
135
-
136
-
137
-
138
-
139
-
140
-
141
-
142
-
143
-
144
-
145
-
146
-
147
-
148
-
149
-
150
-
151
-
152
-
153
-
154
-
155
-
156
-
157
-
158
-
159
-
160
-
161
-
162
-
163
-
164
-
165
-
166
-
167
-
168
-
169
-
170
-
171
-
172
-
173
-
174
-
175
-
176
-
177
-
178
-
179
 |
 |

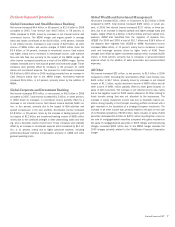
Trading Risk and Return
Daily Trading-Related Revenue and VAR
Daily Trading-
Related
Revenue
VA R
-200
-150
-100
-50
0
50
100
12/31/2006 3/31/2007 6/30/2007 9/30/2007 12/31/2007
(Dollars in millions)
The graph above shows daily trading-related revenue and VAR exclud-
ing the discrete writedowns on our super senior CDO exposure for the
twelve months ended December 31, 2007. Excluding these writedowns,
actual losses exceeded daily trading VAR fourteen times in the twelve
months ended December 31, 2007 and losses did not exceed daily trad-
ing VAR in the twelve months ended December 31, 2006. The losses that
exceeded daily trading VAR for the twelve months ended December 31,
2007, occurred during the market disruption which took place during the
second half of 2007. The sudden increase in market volatility during this
period produced a large number of price changes that exceeded the 99
th
percentile of the three year history used for our VAR calculations.
Table 28 presents average, high and low daily trading VAR for the
twelve months ended December 31, 2007 and 2006.
The increase in average VAR from 2006 was driven by the increased
market volatility during the second half of 2007. In particular, with the
dislocation in structured and credit products, many credit spreads used in
the calculation of VAR increased by unprecedented amounts. In addition,
many trading assets became extremely illiquid which required changes in
assumptions to properly incorporate them in the VAR model as was the
case with our CDO exposure for which we have updated our model at vari-
ous times during the second half of 2007. In periods of stress, the GRC
members communicate daily to discuss losses, VAR limit excesses and
the impact to regulatory capital. As a result of this process, the lines of
business may selectively reduce risk. Where economically feasible, posi-
tions are sold or macro economic hedges are executed to reduce the
exposure.
Stress Testing
Because the very nature of a VAR model suggests results can exceed our
estimates, we also “stress test” our portfolio. Stress testing estimates
the value change in our trading portfolio that may result from abnormal
market movements. Various types of stress tests are run regularly against
the overall trading portfolio and individual businesses. Historical scenarios
simulate the impact of price changes which occurred during a set of
extended historical market events. The results of these scenarios are
reported daily to management. During the twelve months ended
December 31, 2007, the largest daily losses among these scenarios
ranged from $9 million to $529 million.
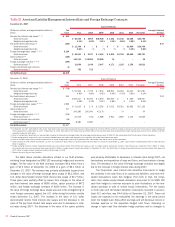
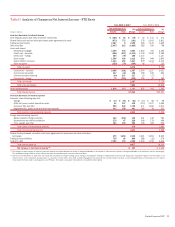
Table 28 Trading Activities Market Risk (1)
Twelve Months Ended December 31
2007 2006
VAR VAR
(Dollars in millions) Average High
(2)
Low
(2)
Average High
(2)
Low
(2)
Foreign exchange
$ 7.2 $25.3 $ 3.8
$ 8.2 $22.9 $ 3.1
Interest rate
13.9 31.9 6.6
18.5 50.0 7.3
Credit
39.5 69.9 23.4
26.8 36.7 18.4
Real estate/mortgage
14.1 23.5 5.7
8.4 12.7 4.7
Equities
24.6 45.8 9.6
18.8 39.6 9.9
Commodities
7.2 10.7 3.7
6.1 9.9 3.4
Portfolio diversification
(53.9) – –
(45.5) – –
Total market-based trading portfolio (3)
$ 52.6 $91.5 $32.9
$ 41.3 $59.8 $26.0
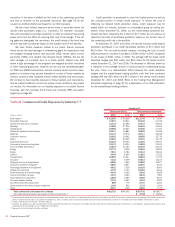
(1) Excludes our discrete writedowns on super senior CDO exposure. For more information on the CDO writedowns and the impact of the market disruption on the Corporation’s results, see the CDO discussion beginning on page
53.
(2) The high and low for the total portfolio may not equal the sum of the individual components as the highs or lows of the individual portfolios may have occurred on different trading days.
(3) For a discussion of the VAR related to the credit derivatives that economically hedge the loan portfolio, see Industry Concentrations beginning on page 79. The table above does not include credit protection purchased to
manage our counterparty credit risk. During the three months ended December 31, 2007, the average VAR of this protection was $9 million.
Bank of America 2007
89