Bank of America 2007 Annual Report Download - page 84
Download and view the complete annual report
Please find page 84 of the 2007 Bank of America annual report below. You can navigate through the pages in the report by either clicking on the pages listed below, or by using the keyword search tool below to find specific information within the annual report.-
 1
1 -
2
-
3
-
4
-
5
-
6
-
7
-
8
-
9
-
10
-
11
-
12
-
13
-
14
-
15
-
16
-
17
-
18
-
19
-
20
-
21
-
22
-
23
-
24
-
25
-
26
-
27
-
28
-
29
-
30
-
31
-
32
-
33
-
34
-
35
-
36
-
37
-
38
-
39
-
40
-
41
-
42
-
43
-
44
-
45
-
46
-
47
-
48
-
49
-
50
-
51
-
52
-
53
-
54
-
55
-
56
-
57
-
58
-
59
-
60
-
61
-
62
-
63
-
64
-
65
-
66
-
67
-
68
-
69
-
70
-
71
-
72
-
73
-
 74
74 -
 75
75 -
 76
76 -
 77
77 -
 78
78 -
 79
79 -
 80
80 -
 81
81 -
 82
82 -
 83
83 -
 84
84 -
 85
85 -
 86
86 -
 87
87 -
 88
88 -
 89
89 -
 90
90 -
 91
91 -
 92
92 -
 93
93 -
 94
94 -
95
-
96
-
97
-
98
-
99
-
100
-
101
-
102
-
103
-
104
-
105
-
106
-
107
-
108
-
109
-
110
-
111
-
112
-
113
-
114
-
115
-
116
-
117
-
118
-
119
-
120
-
121
-
122
-
123
-
124
-
125
-
126
-
127
-
128
-
129
-
130
-
131
-
132
-
133
-
134
-
135
-
136
-
137
-
138
-
139
-
140
-
141
-
142
-
143
-
144
-
145
-
146
-
147
-
148
-
149
-
150
-
151
-
152
-
153
-
154
-
155
-
156
-
157
-
158
-
159
-
160
-
161
-
162
-
163
-
164
-
165
-
166
-
167
-
168
-
169
-
170
-
171
-
172
-
173
-
174
-
175
-
176
-
177
-
178
-
179
 |
 |

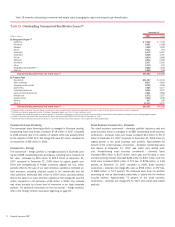
Latin America accounted for $10.9 billion, or eight percent of total
foreign exposure at December 31, 2007, an increase of $1.9 billion, or 22
percent, from December 31, 2006. The increase in exposure in Latin
America was primarily due to higher exposures in Brazil, Mexico, and Chile.
For more information on our Asia Pacific and Latin America exposure, see
the discussion below on foreign exposure to selected countries defined as
emerging markets.
At December 31, 2007, China was the only country where total cross-
border exposure of $17.0 billion, which mostly related to our investment in
CCB, was between 0.75 percent and 1.00 percent of total assets. At
December 31, 2007, we did not operate in any country where the total
cross-border exposure exceeded one percent of our total assets. At
December 31, 2007 and 2006, the United Kingdom had total cross-border
exposure of $12.7 billion and $17.3 billion representing 0.74 percent and
1.18 percent of total assets.
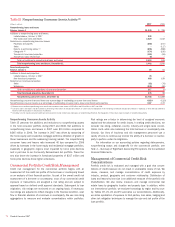
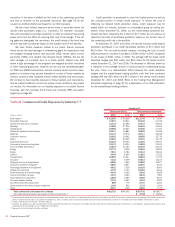
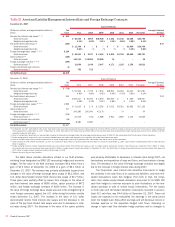
As presented in Table 25, foreign exposure to borrowers or counter-
parties in emerging markets increased $19.6 billion to $40.4 billion at
December 31, 2007, compared to $20.9 billion at December 31, 2006.
The increase was primarily due to the fair value adjustment associated
with our CCB investment as well as higher exposures across most catego-
ries in all regions. Foreign exposure to borrowers or counterparties in
emerging markets represented 29 percent and 16 percent of total foreign
exposure at December 31, 2007 and 2006.
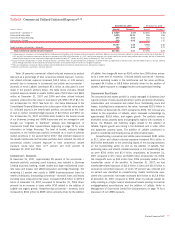
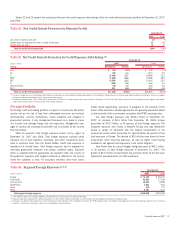
At December 31, 2007, 71 percent of the emerging markets
exposure was in Asia Pacific, compared to 58 percent at December 31,
2006. Asia Pacific emerging markets exposure increased by $16.5 billion.
Growth was driven by higher cross-border exposure mainly in China, India,
South Korea and Singapore. Our exposure in China was primarily related to
the carrying value of our equity investment in CCB which accounted for
$16.4 billion and $3.0 billion at December 31, 2007 and 2006.
At December 31, 2007, 23 percent of the emerging markets
exposure was in Latin America compared to 36 percent at December 31,
2006. Latin America emerging markets exposure increased by $2.0 billion
driven by higher cross-border exposure in Brazil, Mexico, and Chile, as well
as an increase in our equity investment in Banco Itaú. During the first
quarter of 2007, the Corporation completed the sale of its operations in
Chile and Uruguay for approximately $750 million in equity of Banco Itaú.
The carrying value of our investment in Banco Itaú accounted for $2.6 bil-
lion and $1.9 billion of exposure in Brazil at December 31, 2007 and
2006. The December 31, 2007 equity investment in Banco Itaú repre-
sents seven percent of its outstanding voting and non-voting shares. Our
investment in Banco Itaú is currently carried at cost and will be accounted
for as AFS marketable equity securities and carried at fair value beginning
in the second quarter of 2008.
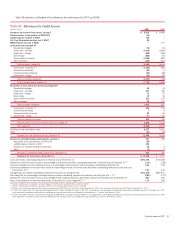
Table 25 Selected Emerging Markets (1)
(Dollars in millions)
Loans and
Leases, and
Loan
Commitments
Other
Financing
(2)
Derivative
Assets
(3)
Securities/
Other
Investments
(4)
Total Cross-
border
Exposure
(5)
Local
Country
Exposure
Net of Local
Liabilities
(6)
Total
Emerging
Market
Exposure at
December 31,
2007
Increase
(Decrease)
From
December 31,
2006
Region/Country
Asia Pacific
China
(7)
$ 262 $ 70 $ 79 $16,629 $17,040 $ –
$17,040
$13,426
South Korea 157 1,000 177 3,068 4,402 –
4,402
1,025
India 1,141 470 355 1,168 3,134 158
3,292
1,257
Singapore 381 25 192 694 1,292 –
1,292
420
Taiwan 345 41 45 169 600 467
1,067
325
Hong Kong 416 100 53 226 795 –
795
(69)
Other Asia Pacific
(8)
133 79 35 401 648 39
687
96
Total Asia Pacific 2,835 1,785 936 22,355 27,911 664
28,575
16,480
Latin America
Mexico 1,181 229 38 2,990 4,438 –
4,438
507
Brazil 701 104 42 2,617 3,464 223
3,687
1,036
Chile 644 55 – 14 713 6
719
393
Other Latin America
(8)
186 170 – 110 466 181
647
113
Total Latin America 2,712 558 80 5,731 9,081 410
9,491
2,049
Middle East and Africa (8) 838 711 170 222 1,941 –
1,941
825
Central and Eastern Europe (8) 42 86 75 221 424 –
424
209
Total emerging market exposure $6,427 $3,140 $1,261 $28,529 $39,357 $1,074
$40,431
$19,563
(1) There is no generally accepted definition of emerging markets. The definition that we use includes all countries in Asia Pacific excluding Japan, Australia and New Zealand; all countries in Latin America excluding Cayman
Islands and Bermuda; all countries in Middle East and Africa; and all countries in Central and Eastern Europe excluding Greece. There was no emerging market exposure included in the portfolio measured at fair value in
accordance with SFAS 159 at December 31, 2007.
(2) Includes acceptances, standby letters of credit, commercial letters of credit and formal guarantees.
(3) Derivative assets are reported on a mark-to-market basis and have been reduced by the amount of cash collateral applied of $57 million and $9 million at December 31, 2007 and 2006. At December 31, 2007 and 2006
there were $2 million and less than $1 million of other marketable securities collateralizing derivative assets for which credit risk has not been reduced.
(4) Generally, cross-border resale agreements are presented based on the domicile of the counterparty, consistent with FFIEC reporting rules. Cross-border resale agreements where the underlying securities are U.S. Treasury
securities, in which case the domicile is the U.S., are excluded from this presentation.
(5) Cross-border exposure includes amounts payable to the Corporation by borrowers or counterparties with a country of residence other than the one in which the credit is booked, regardless of the currency in which the claim is
denominated, consistent with FFIEC reporting rules.
(6) Local country exposure includes amounts payable to the Corporation by borrowers with a country of residence in which the credit is booked, regardless of the currency in which the claim is denominated. Local funding or
liabilities are subtracted from local exposures as allowed by the FFIEC. Total amount of available local liabilities funding local country exposure at December 31, 2007 was $21.6 billion compared to $20.7 billion at
December 31, 2006. Local liabilities at December 31, 2007 in Asia Pacific and Latin America were $19.7 billion and $1.9 billion, of which $7.9 billion were in Hong Kong, $6.2 billion in Singapore, $2.5 billion in South Korea,
$1.8 billion in Mexico, $1.1 billion in China, $836 million in India, and $508 million in Taiwan. There were no other countries with available local liabilities funding local country exposure greater than $500 million.
(7) Securities/Other Investments include an investment of $16.4 billion in CCB. Beginning in the fourth quarter of 2007, the Corporation’s equity investment in CCB was accounted for at fair value. Previously, the investment in
CCB was accounted for at cost.
(8) No country included in Other Asia Pacific, Other Latin America, Middle East and Africa, and Central and Eastern Europe had total foreign exposure of more than $500 million.
82
Bank of America 2007