Bank of America 2007 Annual Report Download - page 60
Download and view the complete annual report
Please find page 60 of the 2007 Bank of America annual report below. You can navigate through the pages in the report by either clicking on the pages listed below, or by using the keyword search tool below to find specific information within the annual report.-
 1
1 -
2
-
3
-
4
-
5
-
6
-
7
-
8
-
9
-
10
-
11
-
12
-
13
-
14
-
15
-
16
-
17
-
18
-
19
-
20
-
21
-
22
-
23
-
24
-
25
-
26
-
27
-
28
-
29
-
30
-
31
-
32
-
33
-
34
-
35
-
36
-
37
-
38
-
39
-
40
-
41
-
42
-
43
-
44
-
45
-
46
-
47
-
48
-
49
-
 50
50 -
 51
51 -
 52
52 -
 53
53 -
 54
54 -
 55
55 -
 56
56 -
 57
57 -
 58
58 -
 59
59 -
 60
60 -
 61
61 -
 62
62 -
 63
63 -
 64
64 -
 65
65 -
 66
66 -
 67
67 -
 68
68 -
 69
69 -
 70
70 -
71
-
72
-
73
-
74
-
75
-
76
-
77
-
78
-
79
-
80
-
81
-
82
-
83
-
84
-
85
-
86
-
87
-
88
-
89
-
90
-
91
-
92
-
93
-
94
-
95
-
96
-
97
-
98
-
99
-
100
-
101
-
102
-
103
-
104
-
105
-
106
-
107
-
108
-
109
-
110
-
111
-
112
-
113
-
114
-
115
-
116
-
117
-
118
-
119
-
120
-
121
-
122
-
123
-
124
-
125
-
126
-
127
-
128
-
129
-
130
-
131
-
132
-
133
-
134
-
135
-
136
-
137
-
138
-
139
-
140
-
141
-
142
-
143
-
144
-
145
-
146
-
147
-
148
-
149
-
150
-
151
-
152
-
153
-
154
-
155
-
156
-
157
-
158
-
159
-
160
-
161
-
162
-
163
-
164
-
165
-
166
-
167
-
168
-
169
-
170
-
171
-
172
-
173
-
174
-
175
-
176
-
177
-
178
-
179
 |
 |
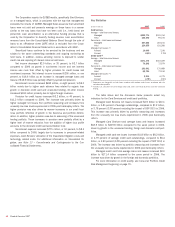
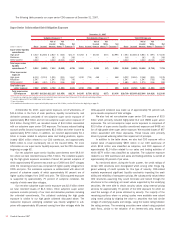
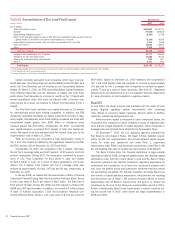
In December 2007, we completed the sale of Marsico and realized a
pre-tax gain on this transaction of approximately $1.5 billion recognized in
All Other. The business results prior to the closing of the Marsico sale are
reflected within the Columbia business.
Net income decreased $135 million, or 41 percent, to $196 million
driven by a decrease of $410 million in all other income. This decrease
was due primarily to losses associated with the support provided to cer-
tain cash funds. Partially offsetting this decrease was higher investment
and brokerage services income of $325 million driven by the contribution
from the U.S. Trust Corporation acquisition, net client inflows and favor-
able market conditions.
We provided support to certain cash funds managed within Columbia.
The funds for which we provided support typically invest in high quality, short-
term securities with a weighted average maturity of 90 days or less, including
a limited number of securities issued by SIVs. Due to market disruptions, cer-
tain SIV investments were downgraded by the rating agencies and experienced
a decline in fair value. We entered into capital commitments which required
the Corporation to provide up to $565 million in cash to the funds in the event
the net asset value per unit of a fund declines below certain thresholds. The
capital commitments expire no later than the third quarter of 2010. At
December 31, 2007, losses of $382 million had been recognized and $183
million is still outstanding associated with this capital commitment.
Additionally, we purchased SIV investments from the funds at their
fair value of $561 million. Losses of $394 million on these investments
were recorded within All Other due to declines in fair value subsequent to
the purchase of such securities.
We may from time to time, but are under no obligation to, provide
additional support to funds managed within Columbia. Future support, if
any, may take the form of additional capital commitments to the funds or
the purchase of assets from the funds.
We are not the primary beneficiary of the cash funds and do not
consolidate the cash funds managed within Columbia because the sub-
ordinated support provided by the Corporation will not absorb a majority of
the variability created by the assets of the funds. The cash funds had total
AUM of approximately $189 billion at December 31, 2007.
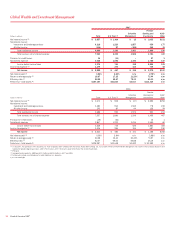
Premier Banking and Investments
PB&I includes Banc of America Investments, our full-service retail broker-
age business and our Premier Banking channel. PB&I brings personalized
banking and investment expertise through priority service with client-
dedicated teams. PB&I provides a high-touch client experience through a
network of approximately 5,600 client facing associates to our affluent
customers with a personal wealth profile that includes investable assets
plus a mortgage that exceeds $500,000 or at least $100,000 of invest-
able assets.
PB&I includes the impact of migrating qualifying affluent customers,
including their related deposit balances, from GCSBB to our PB&I model.
After migration, the associated net interest income, service charges and
noninterest expense is recorded in PB&I. The growth reported in the finan-
cial results of PB&I includes both the impact of migration, as well as the
impact of incremental organic growth from providing a broader array of
financial products and services to PB&I customers. For 2007 and 2006, a
total of $11.4 billion and $10.7 billion of deposits were migrated from
GCSBB to PB&I.
Net income increased $89 million, or eight percent, to $1.3 billion
compared to the same period in 2006 due to an increase in total rev-
enues. Net interest income increased $103 million, or four percent, to
$2.7 billion driven by higher average deposit and loan balances partially
offset by a shift of the product mix in the deposit portfolio and spread
compression. Noninterest income increased $193 million, or 21 percent,
to $1.1 billion driven by higher investment and brokerage services income.
Noninterest expense increased $140 million, or nine percent, to $1.7 bil-
lion primarily due to increases in personnel-related expense driven by the
expansion of client facing associates and higher incentives.
The growth in PB&I revenues was nine percent, of which approx-
imately seven percent was attributable to the impact of migration and two
percent reflected incremental organic growth.
ALM/Other
ALM/Other primarily includes the results of ALM activities.
Net income decreased $99 million, or 39 percent, to $157 million
compared to 2006. The decrease was driven by a $103 million decrease
in net interest income due to a reduction in the contribution from ALM
activities and an increase in noninterest expense of $87 million.
58
Bank of America 2007