Bank of America 2007 Annual Report Download - page 98
Download and view the complete annual report
Please find page 98 of the 2007 Bank of America annual report below. You can navigate through the pages in the report by either clicking on the pages listed below, or by using the keyword search tool below to find specific information within the annual report.-
 1
1 -
2
-
3
-
4
-
5
-
6
-
7
-
8
-
9
-
10
-
11
-
12
-
13
-
14
-
15
-
16
-
17
-
18
-
19
-
20
-
21
-
22
-
23
-
24
-
25
-
26
-
27
-
28
-
29
-
30
-
31
-
32
-
33
-
34
-
35
-
36
-
37
-
38
-
39
-
40
-
41
-
42
-
43
-
44
-
45
-
46
-
47
-
48
-
49
-
50
-
51
-
52
-
53
-
54
-
55
-
56
-
57
-
58
-
59
-
60
-
61
-
62
-
63
-
64
-
65
-
66
-
67
-
68
-
69
-
70
-
71
-
72
-
73
-
74
-
75
-
76
-
77
-
78
-
79
-
80
-
81
-
82
-
83
-
84
-
85
-
86
-
87
-
 88
88 -
 89
89 -
 90
90 -
 91
91 -
 92
92 -
 93
93 -
 94
94 -
 95
95 -
 96
96 -
 97
97 -
 98
98 -
 99
99 -
 100
100 -
 101
101 -
 102
102 -
 103
103 -
 104
104 -
 105
105 -
 106
106 -
 107
107 -
 108
108 -
109
-
110
-
111
-
112
-
113
-
114
-
115
-
116
-
117
-
118
-
119
-
120
-
121
-
122
-
123
-
124
-
125
-
126
-
127
-
128
-
129
-
130
-
131
-
132
-
133
-
134
-
135
-
136
-
137
-
138
-
139
-
140
-
141
-
142
-
143
-
144
-
145
-
146
-
147
-
148
-
149
-
150
-
151
-
152
-
153
-
154
-
155
-
156
-
157
-
158
-
159
-
160
-
161
-
162
-
163
-
164
-
165
-
166
-
167
-
168
-
169
-
170
-
171
-
172
-
173
-
174
-
175
-
176
-
177
-
178
-
179
 |
 |
the reporting unit. For purposes of the market approach, valuations of
reporting units were based on actual comparable market transactions and
market earnings multiples for similar industries of the reporting unit.
Our evaluations for 2007 indicated there was no impairment of
goodwill or intangible assets.
Consolidation and Accounting for Variable Interest
Entities
Under the provisions of FIN 46R, a VIE is consolidated by the entity that
will absorb a majority of the variability created by the assets of the VIE.
The calculation of variability is based on an analysis of projected
probability-weighted cash flows based on the design of the particular VIE.
Scenarios in which expected cash flows are less than or greater than the
expected outcomes create expected losses or expected residual returns.
The entity that will absorb a majority of expected variability (the sum of the
absolute values of the expected losses and expected residual returns)
consolidates the VIE and is referred to as the primary beneficiary.
A variety of qualitative and quantitative assumptions are used to
estimate projected cash flows and the relative probability of each potential
outcome, and to determine which parties will absorb expected losses and
expected residual returns. Critical assumptions, which may include pro-
jected credit losses and interest rates, are independently verified against
market observable data where possible. Where market observable data is
not available, the results of the analysis become more subjective.
As certain events occur, we re-evaluate which parties will absorb
variability and whether we have become or are no longer the primary
beneficiary. Reconsideration events may occur when VIEs acquire addi-
tional assets, issue new variable interests or enter into new or modified
contractual arrangements. A reconsideration event may also occur when
we acquire new or additional interests in a VIE.
In the unlikely event we were required to consolidate our uncon-
solidated VIEs, their consolidation would increase our assets and
liabilities and could have an adverse impact on our Tier 1 Capital, Total
Capital and Tier 1 Leverage Capital ratios.
For more information, see Note 9 – Variable Interest Entities to the
Consolidated Financial Statements.
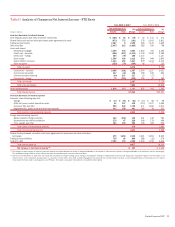
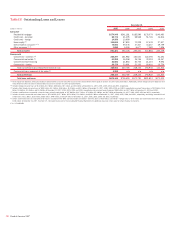
2006 Compared to 2005
The following discussion and analysis provides a comparison of our results
of operations for 2006 and 2005. This discussion should be read in con-
junction with the Consolidated Financial Statements and related Notes.
Tables 5 and 6 contain financial data to supplement this discussion.
Overview
Net Income
Net income totaled $21.1 billion, or $4.59 per diluted common share, in
2006 compared to $16.5 billion, or $4.04 per diluted common share, in
2005. The return on average common shareholders’ equity was 16.27
percent in 2006 compared to 16.51 percent in 2005. These earnings
provided sufficient cash flow to allow us to return $21.2 billion and $10.6
billion in 2006 and 2005, in capital to shareholders in the form of divi-
dends and share repurchases, net of employee stock options exercised.
Net Interest Income
Net interest income on a FTE basis increased $4.2 billion to $35.8 billion
in 2006 compared to 2005. The primary drivers of the increase were the
impact of the MBNA merger (volumes and spreads), consumer and com-
mercial loan growth, and increases in the benefits from ALM activities
including higher portfolio balances (primarily residential mortgages) and
the impact of changes in spreads across all product categories. These
increases were partially offset by a lower contribution from market-based
earning assets and the higher cost associated with higher levels of whole-
sale funding. The net interest yield on a FTE basis decreased two bps to
2.82 percent in 2006 due primarily to an increase in lower yielding market-
based earning assets and loan spreads that continued to tighten due to
the flat to inverted yield curve. These decreases were partially offset by
widening of spreads on core deposits.
Noninterest Income
Noninterest income increased $11.6 billion to $38.0 billion in 2006, due
primarily to increases in card income of $8.5 billion, trading account prof-
its (losses) of $1.4 billion, equity investment income of $977 million, serv-
ice charges of $520 million and other income of $1.2 billion partially
offset by a decrease in gains (losses) on sales of debt securities of $1.5
billion. Card income increased primarily due to the addition of MBNA
resulting in higher excess servicing income, cash advance fees, inter-
change income and late fees. Trading account profits (losses) increased
due to a favorable market environment. Equity investment income
increased primarily due to favorable market conditions driven by liquidity in
the capital markets as well as a gain of $341 million recorded on the
liquidation of a strategic European investment. Service charges grew due
to increased non-sufficient funds fees and overdraft charges, account serv-
ice charges, and ATM fees resulting from new account growth and
increased account usage. Other income increased due to the $720 million
gain on the sale of our Brazilian operations and the $165 million gain on
the sale of our Asia commercial banking business. Gains (losses) on sales
of debt securities were $(443) million and $1.1 billion in 2006 and 2005.
The decrease was primarily due to a loss on the sale of mortgage-backed
securities in 2006 compared to gains recorded in 2005.
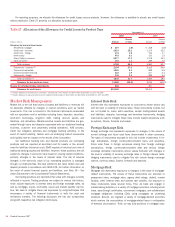
Provision for Credit Losses
The provision for credit losses increased $996 million to $5.0 billion in
2006 compared to 2005. Provision expense rose due to increases from
the addition of MBNA, reduced benefits from releases of commercial
reserves and lower commercial recoveries. These increases were partially
offset by lower bankruptcy-related credit costs on the domestic consumer
credit card portfolio.
Noninterest Expense
Noninterest expense increased $6.9 billion in 2006 from 2005, primarily
due to the MBNA merger, increased personnel expense related to higher
performance-based compensation and higher marketing expense related
to consumer banking initiatives. Amortization of intangibles expense was
higher due to increases in purchased credit card relationships, affinity
relationships, core deposit intangibles and other intangibles, including
trademarks.
Income Tax Expense
Income tax expense was $10.8 billion in 2006 compared to $8.0 billion in
2005, resulting in an effective tax rate of 33.9 percent in 2006 and 32.7
percent in 2005. The increase in the effective tax rate was primarily due to
a $175 million charge to income tax expense arising from the change in
tax legislation, the one-time benefit recorded during 2005 related to the
repatriation of certain foreign earnings and the January 1, 2006 addition of
MBNA.
96
Bank of America 2007