Bank of America 2007 Annual Report Download - page 80
Download and view the complete annual report
Please find page 80 of the 2007 Bank of America annual report below. You can navigate through the pages in the report by either clicking on the pages listed below, or by using the keyword search tool below to find specific information within the annual report.-
 1
1 -
2
-
3
-
4
-
5
-
6
-
7
-
8
-
9
-
10
-
11
-
12
-
13
-
14
-
15
-
16
-
17
-
18
-
19
-
20
-
21
-
22
-
23
-
24
-
25
-
26
-
27
-
28
-
29
-
30
-
31
-
32
-
33
-
34
-
35
-
36
-
37
-
38
-
39
-
40
-
41
-
42
-
43
-
44
-
45
-
46
-
47
-
48
-
49
-
50
-
51
-
52
-
53
-
54
-
55
-
56
-
57
-
58
-
59
-
60
-
61
-
62
-
63
-
64
-
65
-
66
-
67
-
68
-
69
-
 70
70 -
 71
71 -
 72
72 -
 73
73 -
 74
74 -
 75
75 -
 76
76 -
 77
77 -
 78
78 -
 79
79 -
 80
80 -
 81
81 -
 82
82 -
 83
83 -
 84
84 -
 85
85 -
 86
86 -
 87
87 -
 88
88 -
 89
89 -
 90
90 -
91
-
92
-
93
-
94
-
95
-
96
-
97
-
98
-
99
-
100
-
101
-
102
-
103
-
104
-
105
-
106
-
107
-
108
-
109
-
110
-
111
-
112
-
113
-
114
-
115
-
116
-
117
-
118
-
119
-
120
-
121
-
122
-
123
-
124
-
125
-
126
-
127
-
128
-
129
-
130
-
131
-
132
-
133
-
134
-
135
-
136
-
137
-
138
-
139
-
140
-
141
-
142
-
143
-
144
-
145
-
146
-
147
-
148
-
149
-
150
-
151
-
152
-
153
-
154
-
155
-
156
-
157
-
158
-
159
-
160
-
161
-
162
-
163
-
164
-
165
-
166
-
167
-
168
-
169
-
170
-
171
-
172
-
173
-
174
-
175
-
176
-
177
-
178
-
179
 |
 |

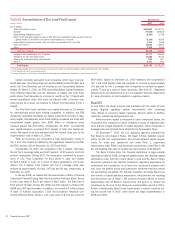
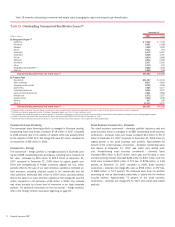
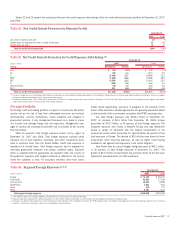
Table 19 presents outstanding commercial real estate loans by geographic region and property type diversification.
Table 19 Outstanding Commercial Real Estate Loans (1)
December 31
(Dollars in millions) 2007 2006
By Geographic Region (2)
California
$ 9,369
$ 7,781
Northeast
8,951
6,368
Midwest
7,832
1,292
Illinois
6,731
979
Southeast
6,472
5,097
Southwest
5,400
3,787
Florida
4,870
3,898
Midsouth
2,843
2,006
Northwest
2,417
2,053
Other
3,370
870
Geographically diversified
(3)
2,282
1,549
Non-U.S.
1,065
578
Total outstanding commercial real estate loans (4)
$61,602
$36,258
By Property Type
Residential
$11,157
$ 8,151
Office buildings
8,837
4,823
Shopping centers/retail
8,722
3,955
Apartments
7,806
4,277
Industrial/warehouse
5,662
3,247
Land and land development
4,551
3,956
Multiple use
1,672
1,257
Hotels/motels
1,535
1,185
Resorts
297
180
Other
(5)
11,363
5,227
Total outstanding commercial real estate loans (4)
$61,602
$36,258
(1) Primarily includes commercial loans and leases secured by non owner-occupied real estate which are dependent on the sale or lease of the real estate as the primary source of repayment.
(2) Distribution is based on geographic location of collateral. Geographic regions are in the U.S. unless otherwise noted.
(3) The geographically diversified category is comprised primarily of unsecured outstandings to real estate investment trusts and national home builders whose portfolios of properties span multiple geographic regions.
(4) Includes commercial real estate loans measured at fair value in accordance with SFAS 159 of $304 million at December 31, 2007.
(5) Represents loans to borrowers whose primary business is commercial real estate, but the exposure is not secured by the listed property types.
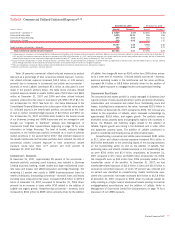
Commercial Lease Financing
The commercial lease financing portfolio is managed in Business Lending.
Outstanding loans and leases increased $718 million in 2007 compared
to 2006 primarily due to the addition of LaSalle which was partially offset
by the adoption of FSP 13-2. Net charge-offs were $2 million compared to
net recoveries of $28 million in 2006.
Commercial – Foreign
The commercial – foreign portfolio is managed primarily in Business Lend-
ing and CMAS. Outstanding loans and leases, including loans measured at
fair value, increased by $8.5 billion to $29.2 billion at December 31,
2007 compared to December 31, 2006 driven by organic growth com-
bined with strengthening of foreign currencies against the U.S. dollar,
partially offset by the sale of our Latin American operations. Criticized uti-
lized exposure, excluding criticized assets in the held-for-sale and fair
value portfolios, decreased $62 million to $509 million, primarily attribut-
able to the sale of our Latin American operations. Net charge-offs were $1
million compared to net recoveries of $8 million in 2006. This increase
was driven primarily by a lower level of recoveries in our large corporate
portfolio. For additional information on the commercial – foreign portfolio,
refer to the Foreign Portfolio discussion beginning on page 81.
Small Business Commercial – Domestic
The small business commercial – domestic portfolio (business card and
small business loans) is managed in GCSBB. Outstanding small business
commercial – domestic loans and leases increased $4.0 billion to $17.8
billion at December 31, 2007 compared to December 31, 2006 driven by
organic growth in the small business card portfolio. Approximately 64
percent of the small business commercial – domestic outstanding loans
and leases at December 31, 2007 was credit card related prod-
ucts. Nonperforming small business commercial – domestic loans
increased $56 million to $135 million, loans past due 90 days or more
and still accruing interest increased $228 million to $427 million and criti-
cized loans increased $419 million or 174 bps, to $796 million, or 4.46
percent, at December 31, 2007 compared to 2006. Small business
commercial – domestic net charge-offs were up $508 million, or 257 bps,
to $869 million, or 5.57 percent. The increases were driven by portfolio
seasoning as well as deterioration particularly in states with the weakest
housing markets. Approximately 70 percent of the small business
commercial – domestic net charge-offs for 2007 were credit card related
products.
78
Bank of America 2007