Bank of America 2007 Annual Report Download - page 119
Download and view the complete annual report
Please find page 119 of the 2007 Bank of America annual report below. You can navigate through the pages in the report by either clicking on the pages listed below, or by using the keyword search tool below to find specific information within the annual report.-
 1
1 -
2
-
3
-
4
-
5
-
6
-
7
-
8
-
9
-
10
-
11
-
12
-
13
-
14
-
15
-
16
-
17
-
18
-
19
-
20
-
21
-
22
-
23
-
24
-
25
-
26
-
27
-
28
-
29
-
30
-
31
-
32
-
33
-
34
-
35
-
36
-
37
-
38
-
39
-
40
-
41
-
42
-
43
-
44
-
45
-
46
-
47
-
48
-
49
-
50
-
51
-
52
-
53
-
54
-
55
-
56
-
57
-
58
-
59
-
60
-
61
-
62
-
63
-
64
-
65
-
66
-
67
-
68
-
69
-
70
-
71
-
72
-
73
-
74
-
75
-
76
-
77
-
78
-
79
-
80
-
81
-
82
-
83
-
84
-
85
-
86
-
87
-
88
-
89
-
90
-
91
-
92
-
93
-
94
-
95
-
96
-
97
-
98
-
99
-
100
-
101
-
102
-
103
-
104
-
105
-
106
-
107
-
108
-
 109
109 -
 110
110 -
 111
111 -
 112
112 -
 113
113 -
 114
114 -
 115
115 -
 116
116 -
 117
117 -
 118
118 -
 119
119 -
 120
120 -
 121
121 -
 122
122 -
 123
123 -
 124
124 -
 125
125 -
 126
126 -
 127
127 -
 128
128 -
 129
129 -
130
-
131
-
132
-
133
-
134
-
135
-
136
-
137
-
138
-
139
-
140
-
141
-
142
-
143
-
144
-
145
-
146
-
147
-
148
-
149
-
150
-
151
-
152
-
153
-
154
-
155
-
156
-
157
-
158
-
159
-
160
-
161
-
162
-
163
-
164
-
165
-
166
-
167
-
168
-
169
-
170
-
171
-
172
-
173
-
174
-
175
-
176
-
177
-
178
-
179
 |
 |

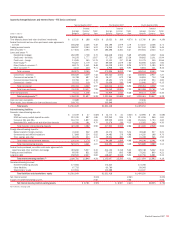
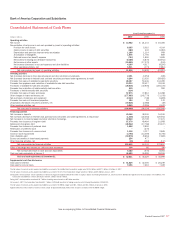
Bank of America Corporation and Subsidiaries
Consolidated Statement of Cash Flows
Year Ended December 31
(Dollars in millions) 2007 2006 2005
Operating activities
Net income
$ 14,982
$ 21,133 $ 16,465
Reconciliation of net income to net cash provided by (used in) operating activities:
Provision for credit losses
8,385
5,010 4,014
(Gains) losses on sales of debt securities
(180)
443 (1,084)
Depreciation and premises improvements amortization
1,168
1,114 959
Amortization of intangibles
1,676
1,755 809
Deferred income tax (benefit) expense
(753)
1,850 1,695
Net increase in trading and derivative instruments
(8,108)
(3,870) (18,911)
Net increase in other assets
(15,855)
(17,070) (104)
Net increase (decrease) in accrued expenses and other liabilities
4,190
4,517 (8,205)
Other operating activities, net
5,531
(373) (7,861)
Net cash provided by (used in) operating activities
11,036
14,509 (12,223)
Investing activities
Net (increase) decrease in time deposits placed and other short-term investments
2,191
(3,053) (439)
Net (increase) decrease in federal funds sold and securities purchased under agreements to resell
6,294
13,020 (58,425)
Proceeds from sales of available-for-sale debt securities
28,107
53,446 134,490
Proceeds from paydowns and maturities of available-for-sale debt securities
19,233
22,417 39,519
Purchases of available-for-sale debt securities
(28,016)
(40,905) (204,476)
Proceeds from maturities of held-to-maturity debt securities
630
7 283
Purchases of held-to-maturity debt securities
(314)
––
Proceeds from sales of loans and leases
57,875
37,812 14,458
Other changes in loans and leases, net
(177,665)
(145,779) (71,078)
Net purchases of premises and equipment
(2,143)
(748) (1,228)
Proceeds from sales of foreclosed properties
104
93 132
(Acquisition) divestiture of business activities, net
(19,816)
(2,388) (49)
Other investing activities, net
5,040
(2,226) (3,632)
Net cash used in investing activities
(108,480)
(68,304) (150,445)
Financing activities
Net increase in deposits
45,368
38,340 16,100
Net increase (decrease) in federal funds purchased and securities sold under agreements to repurchase
(1,448)
(22,454) 120,914
Net increase in commercial paper and other short-term borrowings
32,840
23,709 37,671
Proceeds from issuance of long-term debt
67,370
49,464 21,958
Retirement of long-term debt
(28,942)
(17,768) (15,107)
Proceeds from issuance of preferred stock
1,558
2,850 –
Redemption of preferred stock
–
(270) –
Proceeds from issuance of common stock
1,118
3,117 2,846
Common stock repurchased
(3,790)
(14,359) (5,765)
Cash dividends paid
(10,878)
(9,661) (7,683)
Excess tax benefits of share-based payments
254
477 –
Other financing activities, net
(38)
(312) (117)
Net cash provided by financing activities
103,412
53,133 170,817
Effect of exchange rate changes on cash and cash equivalents
134
92 (86)
Net increase (decrease) in cash and cash equivalents
6,102
(570) 8,063
Cash and cash equivalents at January 1
36,429
36,999 28,936
Cash and cash equivalents at December 31
$ 42,531
$ 36,429 $ 36,999
Supplemental cash flow disclosures
Cash paid for interest
$ 51,829
$ 42,355 $ 26,239
Cash paid for income taxes
9,196
7,210 7,049
The fair values of noncash assets acquired and liabilities assumed in the LaSalle Bank Corporation merger were $115.8 billion and $97.1 billion at October 1, 2007.
The fair values of noncash assets acquired and liabilities assumed in the U.S. Trust Corporation merger were $12.9 billion and $9.8 billion at July 1, 2007.
During 2007, the Corporation sold its operations in Chile and Uruguay for approximately $750 million in equity in Banco Itaú Holding Financeira S.A., and its assets in BankBoston Argentina for the assumption of its liabilities. The
total assets and liabilities in these divestitures were $6.1 billion and $5.6 billion.
During 2007, the Corporation transferred $1.7 billion of trading account assets to AFS debt securities.
On January 1, 2007, the Corporation transferred $3.7 billion of AFS debt securities to trading account assets following the adoption of SFAS 159.
The fair values of noncash assets acquired and liabilities assumed in the MBNA merger were $83.3 billion and $50.4 billion at January 1, 2006.
Approximately 631 million shares of common stock, valued at approximately $28.9 billion were issued in connection with the MBNA merger.
See accompanying Notes to Consolidated Financial Statements.
Bank of America 2007
117