Bank of America 2007 Annual Report Download - page 62
Download and view the complete annual report
Please find page 62 of the 2007 Bank of America annual report below. You can navigate through the pages in the report by either clicking on the pages listed below, or by using the keyword search tool below to find specific information within the annual report.-
 1
1 -
2
-
3
-
4
-
5
-
6
-
7
-
8
-
9
-
10
-
11
-
12
-
13
-
14
-
15
-
16
-
17
-
18
-
19
-
20
-
21
-
22
-
23
-
24
-
25
-
26
-
27
-
28
-
29
-
30
-
31
-
32
-
33
-
34
-
35
-
36
-
37
-
38
-
39
-
40
-
41
-
42
-
43
-
44
-
45
-
46
-
47
-
48
-
49
-
50
-
51
-
 52
52 -
 53
53 -
 54
54 -
 55
55 -
 56
56 -
 57
57 -
 58
58 -
 59
59 -
 60
60 -
 61
61 -
 62
62 -
 63
63 -
 64
64 -
 65
65 -
 66
66 -
 67
67 -
 68
68 -
 69
69 -
 70
70 -
 71
71 -
 72
72 -
73
-
74
-
75
-
76
-
77
-
78
-
79
-
80
-
81
-
82
-
83
-
84
-
85
-
86
-
87
-
88
-
89
-
90
-
91
-
92
-
93
-
94
-
95
-
96
-
97
-
98
-
99
-
100
-
101
-
102
-
103
-
104
-
105
-
106
-
107
-
108
-
109
-
110
-
111
-
112
-
113
-
114
-
115
-
116
-
117
-
118
-
119
-
120
-
121
-
122
-
123
-
124
-
125
-
126
-
127
-
128
-
129
-
130
-
131
-
132
-
133
-
134
-
135
-
136
-
137
-
138
-
139
-
140
-
141
-
142
-
143
-
144
-
145
-
146
-
147
-
148
-
149
-
150
-
151
-
152
-
153
-
154
-
155
-
156
-
157
-
158
-
159
-
160
-
161
-
162
-
163
-
164
-
165
-
166
-
167
-
168
-
169
-
170
-
171
-
172
-
173
-
174
-
175
-
176
-
177
-
178
-
179
 |
 |

due to higher equity investment income and the absence of a loss of $496
million on the sale of mortgage-backed debt securities which occurred in
the prior year. Partially offsetting these items was a $720 million gain on
the sale of our Brazilian operations in 2006 and losses in 2007 of $394
million on securities after they were purchased at fair value from certain
cash funds managed within GWIM. In addition, all noninterest income line
items were impacted by the absence of noninterest income due to the sale
of the Latin American operations and Hong Kong-based retail and commer-
cial banking business which were included in our 2006 results.
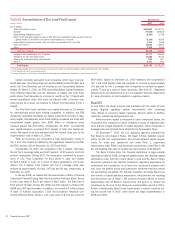
The following table presents the components of All Other’s equity
investment income and a reconciliation to the total consolidated equity
investment income for 2007 and 2006.
Components of Equity Investment Income
(Dollars in millions) 2007 2006
Principal Investing
$2,217
$1,894
Corporate and Strategic Investments
1,528
978
Total equity investment income included in All Other
3,745
2,872
Total equity investment income included in the
business segments
319
317
Total consolidated equity investment income
$4,064
$3,189
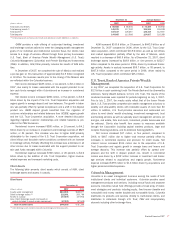
Equity investment income increased $873 million primarily due to the
$600 million gain on the sale of private equity funds to Conversus Capital
and an increase of $533 million in dividends from CCB, including a special
dividend of $184 million prior to CCB’s 2007 share listing. Partially off-
setting these increases was a $341 million gain in 2006 recorded on the
liquidation of a strategic European investment.
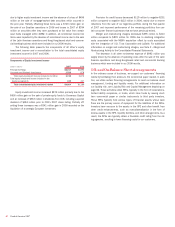
Provision for credit losses decreased $119 million to negative $251
million compared to negative $132 million in 2006, mainly due to reserve
reductions from the sale of our Argentina portfolio during the first quarter
of 2007 and improved performance of the remaining portfolios from cer-
tain consumer finance businesses that we have previously exited.
Merger and restructuring charges decreased $395 million to $410
million compared to $805 million for 2006 due to declining integration
costs associated with the MBNA acquisition offset by costs associated
with the integration of U.S. Trust Corporation and LaSalle. For additional
information on merger and restructuring charges, see Note 2 – Merger and
Restructuring Activity to the Consolidated Financial Statements.
The decrease in all other noninterest expense of $992 million was
largely driven by the absence of operating costs after the sale of the Latin
America operations and Hong Kong-based retail and commercial banking
business which were included in our 2006 results.
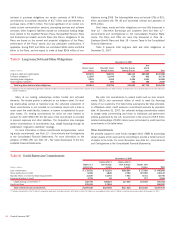
Off- and On-Balance Sheet Arrangements
In the ordinary course of business, we support our customers’ financing
needs by facilitating their access to the commercial paper market. In addi-
tion, we utilize certain financing arrangements to meet our balance sheet
management, funding and liquidity needs. For additional information on
our liquidity risk, see Liquidity Risk and Capital Management beginning on
page 66. These activities utilize SPEs, typically in the form of corporations,
limited liability companies, or trusts, which raise funds by issuing short-
term commercial paper or similar instruments to third party investors.
These SPEs typically hold various types of financial assets whose cash
flows are the primary source of repayment for the liabilities of the SPEs.
Investors have recourse to the assets in the SPE and often benefit from
other credit enhancements, such as overcollateralization in the form of
excess assets in the SPE, liquidity facilities, and other arrangements. As a
result, the SPEs can typically obtain a favorable credit rating from the rat-
ing agencies, resulting in lower financing costs for our customers.
60
Bank of America 2007