Bank of America 2007 Annual Report Download - page 92
Download and view the complete annual report
Please find page 92 of the 2007 Bank of America annual report below. You can navigate through the pages in the report by either clicking on the pages listed below, or by using the keyword search tool below to find specific information within the annual report.-
 1
1 -
2
-
3
-
4
-
5
-
6
-
7
-
8
-
9
-
10
-
11
-
12
-
13
-
14
-
15
-
16
-
17
-
18
-
19
-
20
-
21
-
22
-
23
-
24
-
25
-
26
-
27
-
28
-
29
-
30
-
31
-
32
-
33
-
34
-
35
-
36
-
37
-
38
-
39
-
40
-
41
-
42
-
43
-
44
-
45
-
46
-
47
-
48
-
49
-
50
-
51
-
52
-
53
-
54
-
55
-
56
-
57
-
58
-
59
-
60
-
61
-
62
-
63
-
64
-
65
-
66
-
67
-
68
-
69
-
70
-
71
-
72
-
73
-
74
-
75
-
76
-
77
-
78
-
79
-
80
-
81
-
 82
82 -
 83
83 -
 84
84 -
 85
85 -
 86
86 -
 87
87 -
 88
88 -
 89
89 -
 90
90 -
 91
91 -
 92
92 -
 93
93 -
 94
94 -
 95
95 -
 96
96 -
 97
97 -
 98
98 -
 99
99 -
 100
100 -
 101
101 -
 102
102 -
103
-
104
-
105
-
106
-
107
-
108
-
109
-
110
-
111
-
112
-
113
-
114
-
115
-
116
-
117
-
118
-
119
-
120
-
121
-
122
-
123
-
124
-
125
-
126
-
127
-
128
-
129
-
130
-
131
-
132
-
133
-
134
-
135
-
136
-
137
-
138
-
139
-
140
-
141
-
142
-
143
-
144
-
145
-
146
-
147
-
148
-
149
-
150
-
151
-
152
-
153
-
154
-
155
-
156
-
157
-
158
-
159
-
160
-
161
-
162
-
163
-
164
-
165
-
166
-
167
-
168
-
169
-
170
-
171
-
172
-
173
-
174
-
175
-
176
-
177
-
178
-
179
 |
 |

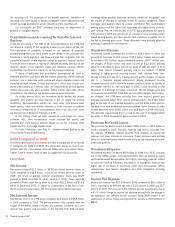
Hypothetical scenarios evaluate the potential impact of extreme but
plausible events over periods as long as one month. These scenarios are
developed to address perceived vulnerabilities in the market and in our
portfolios, and are periodically updated. They are also reviewed and
updated to reflect changing market conditions, such as were experienced
during the second half of 2007. For example, many trading assets became
extremely illiquid which required changes in assumptions to properly
incorporate them in the stress models. This was the case with our CDO-
related exposure for which we have updated our models at various times
during the second half of 2007. Management reviews and evaluates
results of these scenarios monthly. During the twelve months ended
December 31, 2007, the largest daily losses among these scenarios
ranged from $459 million to $1.5 billion. Worst-case losses, which repre-
sent the most extreme losses in our daily VAR calculation, are reported
daily. Finally, desk-level stress tests are performed daily for individual
businesses. These stress tests evaluate the potential adverse impact of
large moves in the market risk factors to which those businesses are
most sensitive.
Interest Rate Risk Management for Nontrading
Activities
Interest rate risk represents the most significant market risk exposure to
our nontrading exposures. Our overall goal is to manage interest rate risk
so that movements in interest rates do not adversely affect core net inter-
est income – managed basis. Interest rate risk is measured as the poten-
tial volatility in our core net interest income – managed basis caused by
changes in market interest rates. Client facing activities, primarily lending
and deposit-taking, create interest rate sensitive positions on our balance
sheet. Interest rate risk from these activities, as well as the impact of
changing market conditions, is managed through our ALM activities.
Simulations are used to estimate the impact on core net interest
income – managed basis using numerous interest rate scenarios, balance
sheet trends and strategies. These simulations evaluate how the above
mentioned scenarios impact core net interest income – managed basis on
short-term financial instruments, debt securities, loans, deposits, borrow-
ings, and derivative instruments. In addition, these simulations
incorporate assumptions about balance sheet dynamics such as loan and
deposit growth and pricing, changes in funding mix, and asset and liability
repricing and maturity characteristics. These simulations do not include
the impact of hedge ineffectiveness.
Management analyzes core net interest income – managed basis
forecasts utilizing different rate scenarios, with the base case utilizing the
forward interest rates. Management frequently updates the core net inter-
est income – managed basis forecast for changing assumptions and differ-
ing outlooks based on economic trends and market conditions. Thus, we
continually monitor our balance sheet position in an effort to maintain an
acceptable level of exposure to interest rate changes.
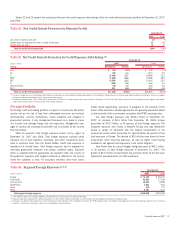
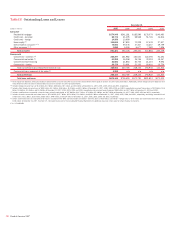
We prepare forward-looking forecasts of core net interest income –
managed basis. These baseline forecasts take into consideration
expected future business growth, ALM positioning, and the direction of
interest rate movements as implied by forward interest rates. We then
measure and evaluate the impact that alternative interest rate scenarios
have to these static baseline forecasts in order to assess interest rate
sensitivity under varied conditions. The spot and 12-month forward
monthly rates used in our respective baseline forecasts at December 31,
2007 and 2006 are shown in Table 29.
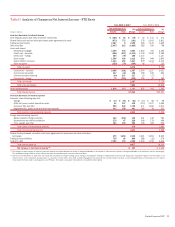
Table 30 reflects the pre-tax dollar impact to forecasted core net
interest income – managed basis over the next twelve months from
December 31, 2007 and 2006, resulting from a 100 bp gradual parallel
increase, a 100 bp gradual parallel decrease, a 100 bp gradual curve flat-
tening (increase in short-term rates or decrease in long-term rates) and a
100 bp gradual curve steepening (decrease in short-term rates or increase
in long-term rates) from the forward market curve. For further discussion of
core net interest income – managed basis see page 44.
The sensitivity analysis in Table 30 assumes that we take no action
in response to these rate shifts over the indicated years. The estimated
exposure is reported on a managed basis and reflects impacts that may
be realized primarily in net interest income and card income. This sensi-
tivity analysis excludes any impact that could occur in the valuation of
retained interests in the Corporation’s securitizations due to changes in
interest rate levels. For additional information on securitizations, see Note
8 – Securitizations to the Consolidated Financial Statements.
Table 29 Forward Rates
December 31
2007 2006
Federal
Funds
Ten-Year
Swap
Federal
Funds
Ten-Year
Swap
Spot rates
4.25% 4.67%
5.25% 5.18%
12-month forward rates
3.13
4.79 4.85 5.19
Table 30 Estimated Core Net Interest Income – Managed Basis at Risk
(Dollars in millions) December 31
Curve Change Short Rate Long Rate 2007 2006
+100 Parallel shift +100 +100
$ (952)
$(557)
-100 Parallel shift -100 -100
865
770
Flatteners
Short end +100 –
(1,127)
(687)
Long end – -100
(386)
(192)
Steepeners
Short end -100 –
1,255
971
Long end – +100
181
138
90
Bank of America 2007