Bank of America 2007 Annual Report Download - page 8
Download and view the complete annual report
Please find page 8 of the 2007 Bank of America annual report below. You can navigate through the pages in the report by either clicking on the pages listed below, or by using the keyword search tool below to find specific information within the annual report.-
 1
1 -
 2
2 -
 3
3 -
 4
4 -
 5
5 -
 6
6 -
 7
7 -
 8
8 -
 9
9 -
 10
10 -
 11
11 -
 12
12 -
 13
13 -
 14
14 -
 15
15 -
 16
16 -
 17
17 -
 18
18 -
 19
19 -
20
-
21
-
22
-
23
-
24
-
25
-
26
-
27
-
28
-
29
-
30
-
31
-
32
-
33
-
34
-
35
-
36
-
37
-
38
-
39
-
40
-
41
-
42
-
43
-
44
-
45
-
46
-
47
-
48
-
49
-
50
-
51
-
52
-
53
-
54
-
55
-
56
-
57
-
58
-
59
-
60
-
61
-
62
-
63
-
64
-
65
-
66
-
67
-
68
-
69
-
70
-
71
-
72
-
73
-
74
-
75
-
76
-
77
-
78
-
79
-
80
-
81
-
82
-
83
-
84
-
85
-
86
-
87
-
88
-
89
-
90
-
91
-
92
-
93
-
94
-
95
-
96
-
97
-
98
-
99
-
100
-
101
-
102
-
103
-
104
-
105
-
106
-
107
-
108
-
109
-
110
-
111
-
112
-
113
-
114
-
115
-
116
-
117
-
118
-
119
-
120
-
121
-
122
-
123
-
124
-
125
-
126
-
127
-
128
-
129
-
130
-
131
-
132
-
133
-
134
-
135
-
136
-
137
-
138
-
139
-
140
-
141
-
142
-
143
-
144
-
145
-
146
-
147
-
148
-
149
-
150
-
151
-
152
-
153
-
154
-
155
-
156
-
157
-
158
-
159
-
160
-
161
-
162
-
163
-
164
-
165
-
166
-
167
-
168
-
169
-
170
-
171
-
172
-
173
-
174
-
175
-
176
-
177
-
178
-
179
 |
 |

6 Bank of America 2007
Many of us had known for some time that these accelerating trends were unsustainable over the long
term. We took several steps in late 2006 and the first half of 2007 to adjust our business to evolving
market trends. But what we didn’t know was how and when the cycle would turn fully, and how the market
adjustments would play out.
Now we know — the failure of several large hedge funds in July caused the credit markets to seize up
completely in August. All market participants were impacted at the same time, and every deal was caught, as
investors struggled to price risk in the market. Late in the year, ratings agencies aggressively
downgraded mortgage-backed securities that had been rated AAA, which contributed to the
large asset writedowns and financial losses across the industry in the fourth quarter.
Two areas that hit banks hardest were collateralized debt obligations, or CDOs, and
structured investment vehicles, or SIVs. Both are financial instruments — asset-backed
borrowings in the simplest view — that banks and investors have used to fund the mortgage
markets. At Bank of America, our exposure in CDOs was significant. Writedowns of the
value of these securities reached $5.6 billion, which was one major cause of our weak
fourth-quarter performance. Our losses in SIVs, by comparison, were relatively small.
The other major cause was the continued rise in credit costs, which drove rapidly expanding
provision expense — money we set aside to cover loan losses — as consumer credit quality has fallen from
historically high levels to more normal levels, affecting most market segments.
These factors were evident in our financial results for the year.
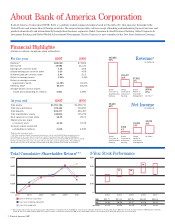
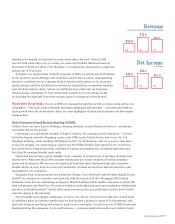
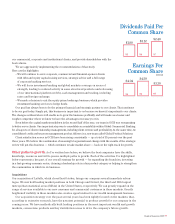
In 2007, Bank of America earned $15.0 billion, down from $21.1 billion in 2006. Earnings per diluted share
fell to $3.30 from $4.59; revenue fell to $68.1 billion from $73.8 billion; and return on common shareholders’
equity fell to 11.08 percent from 16.27 percent. Our efficiency ratio, which had been in our target range (under
50 percent) for the past two years, rose to 54.37 percent. Provision expense rose 67 percent to $8.4 billion from
$5.0 billion, as nonperforming loans and leases and net charge-offs rose to 0.64 percent and 0.84 percent of
total loans and leases, respectively.
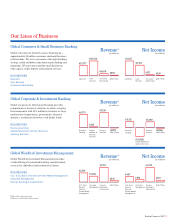
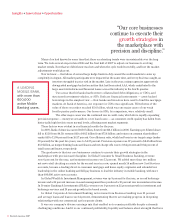
The good news is that our core businesses continue to execute their growth strategies in the
marketplace with precision and discipline. In Global Consumer & Small Business Banking, revenue
rose 6 percent for the year, and noninterest income rose 13 percent. We added more than two million
net new retail checking accounts for the second year in a row, opened nearly 14 million new Card Services
accounts, became a leading direct-to-consumer mortgage and home equity originator and extended our
leadership in the online banking and bill-pay business to lead the industry in mobile banking, with more
than 600,000 active new accounts.
In Global Wealth & Investment Management, revenue was up 8 percent for the year, as record brokerage
income and a 26 percent increase in asset management fees produced a 10 percent rise in noninterest income.
In Premier Banking & Investments (PB&I), revenue rose 9 percent on 22 percent growth in investment and
brokerage services and 19 percent growth in fee-based assets.
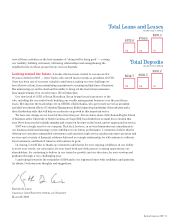
In Global Corporate & Investment Banking, net revenue from Business Lending rose 10 percent
and average loans and leases rose 14 percent, demonstrating that we are making progress in deepening
relationships with our commercial and corporate clients.
It was our company’s diverse earnings mix that enabled us to remain profitable despite extremely
challenging conditions. And it is our continued profitability, liquidity and balance sheet strength that have
“Our core businesses
continue to execute their
growth strategies in
the marketplace with
precision and discipline.”
A LEADING
MOBILE BANK,
with more than
600,000
active Mobile
Banking users.
Insights Innovations Opportunities
+