Bank of America 2007 Annual Report Download - page 63
Download and view the complete annual report
Please find page 63 of the 2007 Bank of America annual report below. You can navigate through the pages in the report by either clicking on the pages listed below, or by using the keyword search tool below to find specific information within the annual report.-
 1
1 -
2
-
3
-
4
-
5
-
6
-
7
-
8
-
9
-
10
-
11
-
12
-
13
-
14
-
15
-
16
-
17
-
18
-
19
-
20
-
21
-
22
-
23
-
24
-
25
-
26
-
27
-
28
-
29
-
30
-
31
-
32
-
33
-
34
-
35
-
36
-
37
-
38
-
39
-
40
-
41
-
42
-
43
-
44
-
45
-
46
-
47
-
48
-
49
-
50
-
51
-
52
-
 53
53 -
 54
54 -
 55
55 -
 56
56 -
 57
57 -
 58
58 -
 59
59 -
 60
60 -
 61
61 -
 62
62 -
 63
63 -
 64
64 -
 65
65 -
 66
66 -
 67
67 -
 68
68 -
 69
69 -
 70
70 -
 71
71 -
 72
72 -
 73
73 -
74
-
75
-
76
-
77
-
78
-
79
-
80
-
81
-
82
-
83
-
84
-
85
-
86
-
87
-
88
-
89
-
90
-
91
-
92
-
93
-
94
-
95
-
96
-
97
-
98
-
99
-
100
-
101
-
102
-
103
-
104
-
105
-
106
-
107
-
108
-
109
-
110
-
111
-
112
-
113
-
114
-
115
-
116
-
117
-
118
-
119
-
120
-
121
-
122
-
123
-
124
-
125
-
126
-
127
-
128
-
129
-
130
-
131
-
132
-
133
-
134
-
135
-
136
-
137
-
138
-
139
-
140
-
141
-
142
-
143
-
144
-
145
-
146
-
147
-
148
-
149
-
150
-
151
-
152
-
153
-
154
-
155
-
156
-
157
-
158
-
159
-
160
-
161
-
162
-
163
-
164
-
165
-
166
-
167
-
168
-
169
-
170
-
171
-
172
-
173
-
174
-
175
-
176
-
177
-
178
-
179
 |
 |

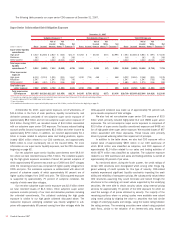
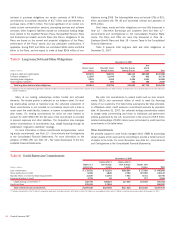
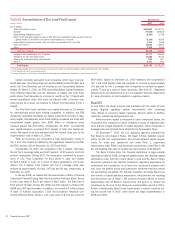
Table 8 Special Purpose Entities Liquidity Exposure (1)
December 31, 2007
VIEs QSPEs
Total(Dollars in millions) Consolidated
(2)
Unconsolidated Unconsolidated
Corporation-sponsored multi-seller conduits
$16,984 $47,335 $ – $ 64,319
Municipal bond trusts and corporate SPEs
7,359 3,120 7,251 17,730
Collateralized debt obligation vehicles
(3)
3,240 9,026 – 12,266
Asset acquisition conduits
1,623 6,399 – 8,022
Customer-sponsored conduits
– 1,724 – 1,724
Total liquidity exposure
$29,206 $67,604 $7,251 $104,061
December 31, 2006
VIEs QSPEs
Total(Dollars in millions) Consolidated
(2)
Unconsolidated Unconsolidated
Corporation-sponsored multi-seller conduits $11,515 $29,836 $ – $ 41,351
Municipal bond trusts and corporate SPEs 272 48 7,593 7,913
Collateralized debt obligation vehicles – 7,658 – 7,658
Asset acquisition conduits 1,083 5,952 – 7,035
Customer-sponsored conduits – 4,586 – 4,586
Total liquidity exposure $12,870 $48,080 $7,593 $ 68,543
(1) Note 9 – Variable Interest Entities to the Consolidated Financial Statements is related to this table but only reflects those entities in which we hold a significant variable interest.
(2) We consolidate VIEs when we are the primary beneficiary that will absorb the majority of the expected losses or expected residual returns of the VIEs or both.
(3) For additional information on our CDO exposures and related writedowns at December 31, 2007, see the CDO discussion beginning on page 53.
We have liquidity agreements, SBLCs or other arrangements with the
SPEs, as described below, under which we are obligated to provide funding
in the event of a market disruption or other specified event or otherwise
provide credit support to the entities (hereinafter referred to as liquidity
exposure). We manage our credit risk and any market risk on these
arrangements by subjecting them to our normal underwriting and risk
management processes. Our credit ratings and changes thereto will affect
the borrowing cost and liquidity of these SPEs. In addition, significant
changes in counterparty asset valuation and credit standing may also
affect the ability of the SPEs to issue commercial paper. The contractual
or notional amount of these commitments as presented in Table 8, repre-
sents our maximum possible funding obligation and is not, in manage-
ment’s view, representative of expected losses or funding requirements.
From time to time, we may purchase commercial paper issued by these
SPEs in connection with market-making activities or for investment pur-
poses. During the second half of 2007, there were instances in which the
asset-backed commercial paper market became illiquid due to market
perceptions of uncertainty and certain investment activities were affected.
As a result, at December 31, 2007, we held $6.6 billion of commercial
paper on the Corporation’s Consolidated Balance Sheet that was issued in
connection with our liquidity obligations to unconsolidated CDOs summar-
ized in the table above. At December 31, 2006, we held $123 million of
commercial paper issued by the SPEs included in the table above.
The table above presents our liquidity exposure to these consolidated
and unconsolidated SPEs, which include VIEs and QSPEs. VIEs are SPEs
which lack sufficient equity at risk or whose equity investors do not have a
controlling financial interest. QSPEs are SPEs whose activities are strictly
limited to holding and servicing financial assets. Some, but not all, of the
liquidity commitments to VIEs are considered to be significant variable
interests and are disclosed in Note 9 – Variable Interest Entities to the
Consolidated Financial Statements. Those liquidity commitments that are
not significant variable interests are not required to be included in Note 9
– Variable Interest Entities to the Consolidated Financial Statements.
At December 31, 2007 the Corporation’s total liquidity exposure to
SPEs was $104.1 billion, an increase of $35.5 billion from December 31,
2006. The increase was primarily due to increases in corporation-
sponsored multi-seller conduits and municipal bond trusts and corporate
SPEs. The increase of $23.0 billion in corporation-sponsored multi-seller
conduits was primarily due to organic growth in the business. The increase
of $9.8 billion in municipal bond trusts and corporate SPEs was mainly
due to the acquisition of LaSalle.
Corporation-Sponsored Multi-Seller Conduits
We administer three multi-seller conduits which provide a low-cost funding
alternative to our customers by facilitating their access to the commercial
paper market. Our customers sell or otherwise transfer assets to the
conduits, which in turn issue high-grade, short-term commercial paper that
is collateralized by the underlying assets. We receive fees for providing
combinations of liquidity and SBLCs or similar loss protection commit-
ments to the conduits. These commitments represent significant variable
interests in the SPEs, which are discussed in more detail in Note 9 –
Variable Interest Entities to the Consolidated Financial Statements. Third
parties participate in a small number of the liquidity facilities on a pari
passu basis with the Corporation.
At December 31, 2007, our liquidity commitments to the conduits
were collateralized by various classes of assets. Assets held in the con-
duits incorporate features such as overcollateralization and cash reserves
which are designed to provide credit support at a level that is equivalent to
an investment grade as determined in accordance with internal risk rating
guidelines. During 2007, there were no material write-downs or down-
grades of assets.
We are the primary beneficiary of one conduit which is included in our
Consolidated Financial Statements. At December 31, 2007, our liquidity
commitments to this conduit were collateralized by credit card loans (21
percent), auto loans (14 percent), equipment loans (13 percent), and
student loans (eight percent). None of these assets are subprime resi-
dential mortgages. In addition, 29 percent of our commitments were
Bank of America 2007
61