Bank of America 2007 Annual Report Download - page 118
Download and view the complete annual report
Please find page 118 of the 2007 Bank of America annual report below. You can navigate through the pages in the report by either clicking on the pages listed below, or by using the keyword search tool below to find specific information within the annual report.-
 1
1 -
2
-
3
-
4
-
5
-
6
-
7
-
8
-
9
-
10
-
11
-
12
-
13
-
14
-
15
-
16
-
17
-
18
-
19
-
20
-
21
-
22
-
23
-
24
-
25
-
26
-
27
-
28
-
29
-
30
-
31
-
32
-
33
-
34
-
35
-
36
-
37
-
38
-
39
-
40
-
41
-
42
-
43
-
44
-
45
-
46
-
47
-
48
-
49
-
50
-
51
-
52
-
53
-
54
-
55
-
56
-
57
-
58
-
59
-
60
-
61
-
62
-
63
-
64
-
65
-
66
-
67
-
68
-
69
-
70
-
71
-
72
-
73
-
74
-
75
-
76
-
77
-
78
-
79
-
80
-
81
-
82
-
83
-
84
-
85
-
86
-
87
-
88
-
89
-
90
-
91
-
92
-
93
-
94
-
95
-
96
-
97
-
98
-
99
-
100
-
101
-
102
-
103
-
104
-
105
-
106
-
107
-
 108
108 -
 109
109 -
 110
110 -
 111
111 -
 112
112 -
 113
113 -
 114
114 -
 115
115 -
 116
116 -
 117
117 -
 118
118 -
 119
119 -
 120
120 -
 121
121 -
 122
122 -
 123
123 -
 124
124 -
 125
125 -
 126
126 -
 127
127 -
 128
128 -
129
-
130
-
131
-
132
-
133
-
134
-
135
-
136
-
137
-
138
-
139
-
140
-
141
-
142
-
143
-
144
-
145
-
146
-
147
-
148
-
149
-
150
-
151
-
152
-
153
-
154
-
155
-
156
-
157
-
158
-
159
-
160
-
161
-
162
-
163
-
164
-
165
-
166
-
167
-
168
-
169
-
170
-
171
-
172
-
173
-
174
-
175
-
176
-
177
-
178
-
179
 |
 |

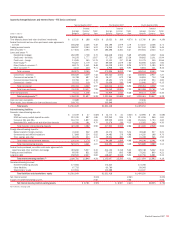
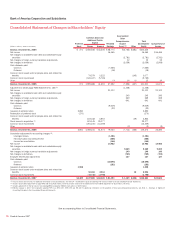
Bank of America Corporation and Subsidiaries
Consolidated Statement of Changes in Shareholders’ Equity
Preferred
Stock
Common Stock and
Additional Paid-in
Capital Retained
Earnings
Accumulated
Other
Comprehensive
Income
(Loss)
(1)
Other
Total
Shareholders’
Equity
Comprehensive
Income
(Dollars in millions, shares in thousands)
Shares Amount
Balance, December 31, 2004 $ 271 4,046,546 $ 44,236 $ 58,773 $(2,764) $(281) $100,235
Net income 16,465 16,465 $16,465
Net changes in available-for-sale debt and marketable equity
securities (2,781) (2,781) (2,781)
Net changes in foreign currency translation adjustments 32 32 32
Net changes in derivatives (2,059) (2,059) (2,059)
Cash dividends paid:
Common (7,665) (7,665)
Preferred (18) (18)
Common stock issued under employee plans and related tax
benefits 79,579 3,222 (145) 3,077
Common stock repurchased (126,437) (5,765) (5,765)
Other (3) 16 (1) 12 16
Balance, December 31, 2005 271 3,999,688 41,693 67,552 (7,556) (427) 101,533 11,673
Adjustment to initially apply FASB Statement No. 158
(2)
(1,308) (1,308)
Net income 21,133 21,133 21,133
Net changes in available-for-sale debt and marketable equity
securities 245 245 245
Net changes in foreign currency translation adjustments 269 269 269
Net changes in derivatives 641 641 641
Cash dividends paid:
Common (9,639) (9,639)
Preferred (22) (22)
Issuance of preferred stock 2,850 2,850
Redemption of preferred stock (270) (270)
Common stock issued under employee plans and related tax
benefits 118,418 4,863 (39) 4,824
Stock issued in acquisition
(3)
631,145 29,377 29,377
Common stock repurchased (291,100) (14,359) (14,359)
Other (2) (2) (2)
Balance, December 31, 2006 2,851 4,458,151 61,574 79,024 (7,711) (466) 135,272 22,286
Cumulative adjustment for accounting changes
(4)
:
Leveraged leases
(1,381) (1,381)
Fair value option and measurement
(208) (208)
Income tax uncertainties
(146) (146)
Net income
14,982 14,982 14,982
Net changes in available-for-sale debt and marketable equity
securities
9,269 9,269 9,269
Net changes in foreign currency translation adjustments
149 149 149
Net changes in derivatives
(705) (705) (705)
Employee benefit plan adjustments
127 127 127
Cash dividends paid:
Common
(10,696) (10,696)
Preferred
(182) (182)
Issuance of preferred stock
1,558 1,558
Common stock issued under employee plans and related tax
benefits
53,464 2,544 10 2,554
Common stock repurchased
(73,730) (3,790) (3,790)
Balance, December 31, 2007
$4,409 4,437,885 $ 60,328 $ 81,393 $ 1,129 $(456) $146,803 $23,822
(1) Amounts shown are net-of-tax. For additional information on accumulated OCI, see Note 14 – Shareholders’ Equity and Earnings Per Common Share to the Consolidated Financial Statements.
(2) Includes accumulated adjustment to apply SFAS 158 of $(1,428) million, net-of-tax, and the reversal of the additional minimum liability adjustment of $120 million, net-of-tax.
(3) Includes adjustment for the fair value of outstanding MBNA Corporation (MBNA) stock options of $435 million.
(4) Effective January 1, 2007, the Corporation adopted FSP 13-2, SFAS 157, SFAS 159 and FIN 48. For additional information on the adoption of these accounting pronouncements, see Note 1 – Summary of Significant
Accounting Principles to the Consolidated Financial Statements.
See accompanying Notes to Consolidated Financial Statements.
116
Bank of America 2007