Bank of America 2007 Annual Report Download - page 159
Download and view the complete annual report
Please find page 159 of the 2007 Bank of America annual report below. You can navigate through the pages in the report by either clicking on the pages listed below, or by using the keyword search tool below to find specific information within the annual report.-
 1
1 -
2
-
3
-
4
-
5
-
6
-
7
-
8
-
9
-
10
-
11
-
12
-
13
-
14
-
15
-
16
-
17
-
18
-
19
-
20
-
21
-
22
-
23
-
24
-
25
-
26
-
27
-
28
-
29
-
30
-
31
-
32
-
33
-
34
-
35
-
36
-
37
-
38
-
39
-
40
-
41
-
42
-
43
-
44
-
45
-
46
-
47
-
48
-
49
-
50
-
51
-
52
-
53
-
54
-
55
-
56
-
57
-
58
-
59
-
60
-
61
-
62
-
63
-
64
-
65
-
66
-
67
-
68
-
69
-
70
-
71
-
72
-
73
-
74
-
75
-
76
-
77
-
78
-
79
-
80
-
81
-
82
-
83
-
84
-
85
-
86
-
87
-
88
-
89
-
90
-
91
-
92
-
93
-
94
-
95
-
96
-
97
-
98
-
99
-
100
-
101
-
102
-
103
-
104
-
105
-
106
-
107
-
108
-
109
-
110
-
111
-
112
-
113
-
114
-
115
-
116
-
117
-
118
-
119
-
120
-
121
-
122
-
123
-
124
-
125
-
126
-
127
-
128
-
129
-
130
-
131
-
132
-
133
-
134
-
135
-
136
-
137
-
138
-
139
-
140
-
141
-
142
-
143
-
144
-
145
-
146
-
147
-
148
-
 149
149 -
 150
150 -
 151
151 -
 152
152 -
 153
153 -
 154
154 -
 155
155 -
 156
156 -
 157
157 -
 158
158 -
 159
159 -
 160
160 -
 161
161 -
 162
162 -
 163
163 -
 164
164 -
 165
165 -
 166
166 -
 167
167 -
 168
168 -
 169
169 -
170
-
171
-
172
-
173
-
174
-
175
-
176
-
177
-
178
-
179
 |
 |

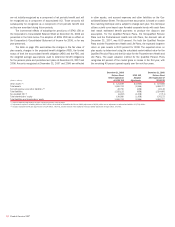
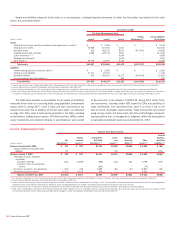
Pre-tax amounts recognized in OCI for 2007 included the following components:
Qualified
Pension
Plans
Nonqualified
Pension
Plans
Postretirement
Health and
Life Plans Total(Dollars in millions)
Other changes in plan assets and benefit obligations recognized in OCI
Settlements and curtailments
$ – $(14) $ 2 $ (12)
Current year actuarial (gain) loss
167 (74) (100) (7)
Amortization of actuarial gain (loss)
(156) (17) 60 (113)
Current year prior service (credit) cost
3 (1) – 2
Amortization of prior service credit (cost)
(47) 7 – (40)
Amortization of transition asset (obligation)
– – (32) (32)
Total recognized in OCI
$ (33) $(99) $ (70) $(202)
The estimated net actuarial (gain) loss and prior service cost (credit)
for the Qualified Pension Plans that will be amortized from accumulated
OCI into net periodic benefit cost (income) during 2008 are pre-tax
amounts of $64 million and $47 million. The estimated net actuarial (gain)
loss and prior service cost (credit) for the Nonqualified Pension Plans that
will be amortized from accumulated OCI into net periodic benefit cost
(income) during 2008 are pre-tax amounts of $11 million and $(8) million.
The estimated net actuarial (gain) loss and transition obligation for the
Postretirement Health and Life Plans that will be amortized from accumu-
lated OCI into net periodic benefit cost (income) during 2008 are pre-tax
amounts of $(32) million and $31 million.
Plan Assets
The Qualified Pension Plans have been established as retirement vehicles
for participants, and trusts have been established to secure benefits
promised under the Qualified Pension Plans. The Corporation’s policy is to
invest the trust assets in a prudent manner for the exclusive purpose of
providing benefits to participants and defraying reasonable expenses of
administration. The Corporation’s investment strategy is designed to pro-
vide a total return that, over the long-term, increases the ratio of assets to
liabilities. The strategy attempts to maximize the investment return on
assets at a level of risk deemed appropriate by the Corporation while
complying with ERISA and any applicable regulations and laws. The
investment strategy utilizes asset allocation as a principal determinant for
establishing the risk/reward profile of the assets. Asset allocation ranges
are established, periodically reviewed, and adjusted as funding levels and
liability characteristics change. Active and passive investment managers
are employed to help enhance the risk/return profile of the assets. An
additional aspect of the investment strategy used to minimize risk (part of
the asset allocation plan) includes matching the equity exposure of
participant-selected earnings measures. For example, the common stock
of the Corporation held in the trust is maintained as an offset to the
exposure related to participants who selected to receive an earnings
measure based on the return performance of common stock of the Corpo-
ration. No plan assets are expected to be returned to the Corporation
during 2008.
The Expected Return on Asset Assumption (EROA assumption) was
developed through analysis of historical market returns, historical asset
class volatility and correlations, current market conditions, anticipated
future asset allocations, the funds’ past experience, and expectations on
potential future market returns. The EROA assumption represents a long-
term average view of the performance of the Qualified Pension Plans and
Postretirement Health and Life Plan assets, a return that may or may not
be achieved during any one calendar year. In a simplistic analysis of the
EROA assumption, the building blocks used to arrive at the long-term
return assumption would include an implied return from equity securities
of 8.75 percent, debt securities of 5.75 percent, and real estate of 7.00
percent for all pension plans and postretirement health and life plans.
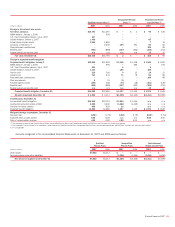
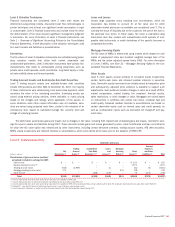
The Qualified Pension Plans’ and Postretirement Health and Life
Plans’ asset allocations at December 31, 2007 and 2006 and target allo-
cations for 2008 by asset category are presented in the table below.
Equity securities for the Qualified Pension Plans include common
stock of the Corporation in the amounts of $667 million (3.56 percent of
total plan assets) and $882 million (5.25 percent of total plan assets) at
December 31, 2007 and 2006.
The Bank of America, MBNA, U.S. Trust Corporation, and LaSalle
Postretirement Health and Life Plans had no investment in the common
stock of the Corporation at December 31, 2007 or 2006. The FleetBoston
Postretirement Health and Life Plans included common stock of the Corpo-
ration in the amount of $0.3 million (0.20 percent of total plan assets)
and $0.4 million (0.46 percent of total plan assets) at December 31,
2007 and 2006.
Asset Category
Qualified Pension Plans Postretirement Health and Life Plans
2008
Target
Allocation
Percentage of
Plan Assets at
December 31 2008
Target
Allocation
Percentage of
Plan Assets at
December 31
2007 2006 2007 2006
Equity securities 60 – 80%
70%
68% 50 – 75%
67%
61%
Debt securities 20 – 40
27
30 25 – 45
30
36
Real estate 0–5
3
20–5
3
3
Total
100%
100%
100%
100%
Bank of America 2007
157