Bank of America 2007 Annual Report Download - page 109
Download and view the complete annual report
Please find page 109 of the 2007 Bank of America annual report below. You can navigate through the pages in the report by either clicking on the pages listed below, or by using the keyword search tool below to find specific information within the annual report.-
 1
1 -
2
-
3
-
4
-
5
-
6
-
7
-
8
-
9
-
10
-
11
-
12
-
13
-
14
-
15
-
16
-
17
-
18
-
19
-
20
-
21
-
22
-
23
-
24
-
25
-
26
-
27
-
28
-
29
-
30
-
31
-
32
-
33
-
34
-
35
-
36
-
37
-
38
-
39
-
40
-
41
-
42
-
43
-
44
-
45
-
46
-
47
-
48
-
49
-
50
-
51
-
52
-
53
-
54
-
55
-
56
-
57
-
58
-
59
-
60
-
61
-
62
-
63
-
64
-
65
-
66
-
67
-
68
-
69
-
70
-
71
-
72
-
73
-
74
-
75
-
76
-
77
-
78
-
79
-
80
-
81
-
82
-
83
-
84
-
85
-
86
-
87
-
88
-
89
-
90
-
91
-
92
-
93
-
94
-
95
-
96
-
97
-
98
-
 99
99 -
 100
100 -
 101
101 -
 102
102 -
 103
103 -
 104
104 -
 105
105 -
 106
106 -
 107
107 -
 108
108 -
 109
109 -
 110
110 -
 111
111 -
 112
112 -
 113
113 -
 114
114 -
 115
115 -
 116
116 -
 117
117 -
 118
118 -
 119
119 -
120
-
121
-
122
-
123
-
124
-
125
-
126
-
127
-
128
-
129
-
130
-
131
-
132
-
133
-
134
-
135
-
136
-
137
-
138
-
139
-
140
-
141
-
142
-
143
-
144
-
145
-
146
-
147
-
148
-
149
-
150
-
151
-
152
-
153
-
154
-
155
-
156
-
157
-
158
-
159
-
160
-
161
-
162
-
163
-
164
-
165
-
166
-
167
-
168
-
169
-
170
-
171
-
172
-
173
-
174
-
175
-
176
-
177
-
178
-
179
 |
 |

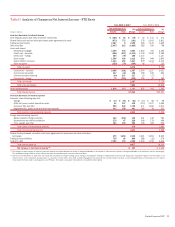
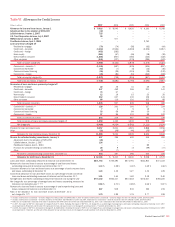
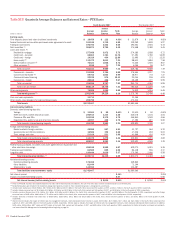
Table XII Selected Quarterly Financial Data
2007 Quarters 2006 Quarters
(Dollars in millions, except per share information) Fourth Third Second First Fourth Third Second First
Income statement
Net interest income
$ 9,164
$ 8,615 $ 8,386 $ 8,268 $ 8,599 $ 8,586 $ 8,630 $ 8,776
Noninterest income
3,508
7,314 11,177 9,887 9,887 9,598 9,589 8,915
Total revenue, net of interest expense
12,672
15,929 19,563 18,155 18,486 18,184 18,219 17,691
Provision for credit losses
3,310
2,030 1,810 1,235 1,570 1,165 1,005 1,270
Noninterest expense, before merger and
restructuring charges
10,137
8,459 9,018 8,986 8,849 8,594 8,523 8,826
Merger and restructuring charges
140
84 75 111 244 269 194 98
Income (loss) before income taxes
(915)
5,356 8,660 7,823 7,823 8,156 8,497 7,497
Income tax expense (benefit)
(1,183)
1,658 2,899 2,568 2,567 2,740 3,022 2,511
Net income
268
3,698 5,761 5,255 5,256 5,416 5,475 4,986
Average common shares issued and
outstanding (in thousands)
4,421,554
4,420,616 4,419,246 4,432,664 4,464,110 4,499,704 4,534,627 4,609,481
Average diluted common shares issued
and outstanding (in thousands)
4,470,108
4,475,917 4,476,799 4,497,028 4,536,696 4,570,558 4,601,169 4,666,405
Performance ratios
Return on average assets
0.06 %
0.93 % 1.48 % 1.40 % 1.39 % 1.43 % 1.51 % 1.43 %
Return on average common shareholders’
equity
0.60
11.02 17.55 16.16 15.76 16.64 17.26 15.44
Total ending equity to total ending assets
8.56
8.77 8.85 8.98 9.27 9.22 8.85 9.41
Total average equity to total average
assets
8.32
8.51 8.55 8.78 8.97 8.63 8.75 9.26
Dividend payout
n/m
77.97 43.60 48.02 47.49 46.82 41.76 46.75
Per common share data
Earnings
$ 0.05
$ 0.83 $ 1.29 $ 1.18 $ 1.17 $ 1.20 $ 1.21 $ 1.08
Diluted earnings
0.05
0.82 1.28 1.16 1.16 1.18 1.19 1.07
Dividends paid
0.64
0.64 0.56 0.56 0.56 0.56 0.50 0.50
Book value
32.09
30.45 29.95 29.74 29.70 29.52 28.17 28.19
Market price per share of common stock
Closing
$ 41.26
$ 50.27 $ 48.89 $ 51.02 $ 53.39 $ 53.57 $ 48.10 $ 45.54
High closing
52.71
51.87 51.82 54.05 54.90 53.57 50.47 47.08
Low closing
41.10
47.00 48.80 49.46 51.66 47.98 45.48 43.09
Market capitalization
$ 183,107
$ 223,041 $ 216,922 $ 226,481 $ 238,021 $ 240,966 $ 217,794 $ 208,633
Average balance sheet
Total loans and leases
$ 868,119
$ 780,516 $ 740,199 $ 714,042 $ 683,598 $ 673,477 $ 635,649 $ 615,968
Total assets
1,742,467
1,580,565 1,561,649 1,521,418 1,495,150 1,497,987 1,456,004 1,416,373
Total deposits
781,625
702,481 697,035 686,704 680,245 676,851 674,796 659,821
Long-term debt
196,444
175,265 158,500 148,627 140,756 136,769 125,620 117,018
Common shareholders’ equity
141,085
131,606 130,700 130,737 132,004 129,098 127,102 130,881
Total shareholders’ equity
144,924
134,487 133,551 133,588 134,047 129,262 127,373 131,153
Asset Quality
Allowance for credit losses
(1)
$ 12,106
$ 9,927 $ 9,436 $ 9,106 $ 9,413 $ 9,260 $ 9,475 $ 9,462
Nonperforming assets measured at
historical cost
5,948
3,372 2,392 2,059 1,856 1,656 1,641 1,680
Allowance for loan and lease losses as a
percentage of total loans and leases
outstanding measured at historical
cost
(2)
1.33 %
1.21 % 1.20 % 1.21 % 1.28 % 1.33 % 1.36 % 1.46 %
Allowance for loan and lease losses as a
percentage of total nonperforming loans
and leases measured at historical cost
207
300 397 443 505 562 579 572
Net charge-offs
$ 1,985
$ 1,573 $ 1,495 $ 1,427 $ 1,417 $ 1,277 $ 1,023 $ 822
Annualized net charge-offs as a percentage
of average loans and leases outstanding
measured at historical cost
(2)
0.91 %
0.80 % 0.81 % 0.81 % 0.82 % 0.75 % 0.65 % 0.54 %
Nonperforming loans and leases as a
percentage of total loans and leases
outstanding measured at historical cost
(2)
0.64
0.40 0.30 0.27 0.25 0.24 0.23 0.26
Nonperforming assets as a percentage of
total loans, leases and foreclosed
properties
(2)
0.68
0.43 0.32 0.29 0.26 0.25 0.25 0.27
Ratio of the allowance for loan and lease
losses at period end to annualized net
charge-offs
1.47
1.53 1.51 1.51 1.60 1.75 2.21 2.72
Capital ratios (period end)
Risk-based capital:
Tier 1
6.87 %
8.22 % 8.52 % 8.57 % 8.64 % 8.48 % 8.33 % 8.45 %
Total
11.02
11.86 12.11 11.94 11.88 11.46 11.25 11.32
Tier 1 Leverage
5.04
6.20 6.33 6.25 6.36 6.16 6.13 6.18
(1) Includes the allowance for loan and lease losses, and the reserve for unfunded lending commitments.
(2) Ratios do not include loans measured at fair value in accordance with SFAS 159 at and for the year ended December 31, 2007. Loans measured at fair value were $4.59 billion at December 31, 2007.
n/m = not meaningful
Bank of America 2007
107