Bank of America 2007 Annual Report Download - page 153
Download and view the complete annual report
Please find page 153 of the 2007 Bank of America annual report below. You can navigate through the pages in the report by either clicking on the pages listed below, or by using the keyword search tool below to find specific information within the annual report.-
 1
1 -
2
-
3
-
4
-
5
-
6
-
7
-
8
-
9
-
10
-
11
-
12
-
13
-
14
-
15
-
16
-
17
-
18
-
19
-
20
-
21
-
22
-
23
-
24
-
25
-
26
-
27
-
28
-
29
-
30
-
31
-
32
-
33
-
34
-
35
-
36
-
37
-
38
-
39
-
40
-
41
-
42
-
43
-
44
-
45
-
46
-
47
-
48
-
49
-
50
-
51
-
52
-
53
-
54
-
55
-
56
-
57
-
58
-
59
-
60
-
61
-
62
-
63
-
64
-
65
-
66
-
67
-
68
-
69
-
70
-
71
-
72
-
73
-
74
-
75
-
76
-
77
-
78
-
79
-
80
-
81
-
82
-
83
-
84
-
85
-
86
-
87
-
88
-
89
-
90
-
91
-
92
-
93
-
94
-
95
-
96
-
97
-
98
-
99
-
100
-
101
-
102
-
103
-
104
-
105
-
106
-
107
-
108
-
109
-
110
-
111
-
112
-
113
-
114
-
115
-
116
-
117
-
118
-
119
-
120
-
121
-
122
-
123
-
124
-
125
-
126
-
127
-
128
-
129
-
130
-
131
-
132
-
133
-
134
-
135
-
136
-
137
-
138
-
139
-
140
-
141
-
142
-
 143
143 -
 144
144 -
 145
145 -
 146
146 -
 147
147 -
 148
148 -
 149
149 -
 150
150 -
 151
151 -
 152
152 -
 153
153 -
 154
154 -
 155
155 -
 156
156 -
 157
157 -
 158
158 -
 159
159 -
 160
160 -
 161
161 -
 162
162 -
 163
163 -
164
-
165
-
166
-
167
-
168
-
169
-
170
-
171
-
172
-
173
-
174
-
175
-
176
-
177
-
178
-
179
 |
 |

holders of these series have no general voting rights. If any quarterly divi-
dend payable on these series is in arrears for six or more quarterly divi-
dend periods (whether consecutive or not), the holders of these series and
any other class or series of preferred stock ranking equally as to payment
of dividends and upon which equivalent voting rights have been conferred
and are exercisable (voting as a single class) will be entitled to vote for
the election of two additional directors. These voting rights terminate when
the Corporation has paid in full dividends on these series for at least four
quarterly dividend periods following the dividend arrearage.
On July 14, 2006, the Corporation redeemed its 6.75% Perpetual
Preferred Stock with a stated value of $250 per share. The 382 thousand
shares, or $96 million, outstanding of preferred stock were redeemed at
the stated value of $250 per share, plus accrued and unpaid dividends.
On July 3, 2006, the Corporation redeemed its Fixed/Adjustable Rate
Cumulative Preferred Stock with a stated value of $250 per share. The
700 thousand shares, or $175 million, outstanding of preferred stock
were redeemed at the stated value of $250 per share, plus accrued and
unpaid dividends.
In addition to the preferred stock described above, the Corporation
had eight thousand shares, or $1 million, outstanding of the 7% Cumu-
lative Redeemable Preferred Stock with a stated value of $100 per share
paying dividends quarterly at an annual rate of 7.00 percent.
All preferred stock outstanding has preference over the Corporation’s
common stock with respect to the payment of dividends and distribution of
the Corporation’s assets in the event of a liquidation or dissolution.
Except in certain circumstances, the holders of preferred stock have no
voting rights.
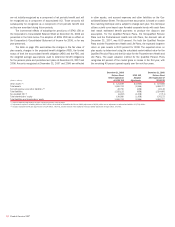
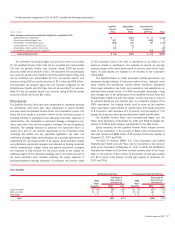
Accumulated OCI
The following table presents the changes in accumulated OCI for 2007, 2006 and 2005, net-of-tax.
(Dollars in millions) Securities
(1, 2)
Derivatives
(3)
Employee
Benefit Plans
Foreign
Currency Total
Balance, December 31, 2006
$(2,733) $(3,697) $(1,428)
$ 147 $ (7,711)
Net change in fair value recorded in accumulated OCI
(4)
9,416 (1,252)
4 142 8,310
Net realized (gains) losses reclassified into earnings
(5)
(147)
547 123 7 530
Balance, December 31, 2007
$ 6,536 $(4,402)
$ (1,301) $ 296 $ 1,129
Balance, December 31, 2005 $(2,978) $(4,338) $ (118) $(122) $(7,556)
Net change in fair value recorded in accumulated OCI
(6)
465 534 (1,310) 219 (92)
Net realized (gains) losses reclassified into earnings
(5)
(220) 107 – 50 (63)
Balance, December 31, 2006 $(2,733) $(3,697) $(1,428) $ 147 $(7,711)
Balance, December 31, 2004 $ (197) $(2,279) $ (134) $(154) $(2,764)
Net change in fair value recorded in accumulated OCI (1,907) (2,225) 16 32 (4,084)
Net realized (gains) losses reclassified into earnings
(5)
(874) 166 – – (708)
Balance, December 31, 2005 $(2,978) $(4,338) $ (118) $(122) $(7,556)
(1) In 2007, 2006 and 2005, the Corporation reclassified net realized (gains) losses into earnings on the sales and impairments of AFS debt securities of $137 million, $279 million and $(683) million, net-of-tax, respectively,
and (gains) losses on the sales of AFS marketable equity securities of $(284) million, $(499) million, and $(191) million, net-of-tax, respectively.
(2) Accumulated OCI includes fair value losses of $15 million and gains of $135 million, net-of-tax, on certain retained interests in the Corporation’s securitization transactions that were included in other assets at December 31,
2007 and 2006.
(3) The amounts included in accumulated OCI for terminated derivative contracts were losses of $3.8 billion, $3.2 billion and $2.5 billion, net-of-tax, at December 31, 2007, 2006 and 2005, respectively.
(4) Securities include the fair value adjustment of $8.4 billion, net-of-tax, related to the Corporation’s investment in CCB.
(5) Included in this line item are amounts related to derivatives used in cash flow hedge relationships. These amounts are reclassified into earnings in the same period or periods during which the hedged forecasted transactions
affect earnings. This line item also includes (gains) losses on AFS debt and marketable equity securities and impairments. These amounts are reclassified into earnings upon sale of the related security.
(6) Employee benefit plans include the accumulated adjustment to initially apply SFAS 158 of $(1.3) billion.
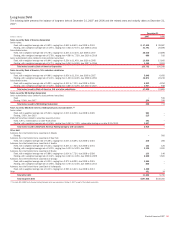
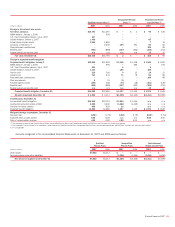
Earnings per Common Share
The calculation of earnings per common share and diluted earnings per common share for 2007, 2006 and 2005 is presented below. See Note 1 – Sum-
mary of Significant Accounting Principles to the Consolidated Financial Statements for a discussion on the calculation of earnings per common share.
(Dollars in millions, except per share information; shares in thousands) 2007 2006 2005
Earnings per common share
Net income
$ 14,982
$ 21,133 $ 16,465
Preferred stock dividends
(182)
(22) (18)
Net income available to common shareholders
$ 14,800
$ 21,111 $ 16,447
Average common shares issued and outstanding
4,423,579
4,526,637 4,008,688
Earnings per common share
$ 3.35
$ 4.66 $ 4.10
Diluted earnings per common share
Net income available to common shareholders
$ 14,800
$ 21,111 $ 16,447
Average common shares issued and outstanding
4,423,579
4,526,637 4,008,688
Dilutive potential common shares
(1, 2)
56,675
69,259 59,452
Total diluted average common shares issued and outstanding
4,480,254
4,595,896 4,068,140
Diluted earnings per common share
$ 3.30
$ 4.59 $ 4.04
(1) For 2007, 2006 and 2005, average options to purchase 28 million, 355 thousand and 39 million shares, respectively, were outstanding but not included in the computation of earnings per common share because they were
antidilutive.
(2) Includes incremental shares from restricted stock units, restricted stock shares and stock options.
Bank of America 2007
151