Bank of America 2007 Annual Report Download - page 51
Download and view the complete annual report
Please find page 51 of the 2007 Bank of America annual report below. You can navigate through the pages in the report by either clicking on the pages listed below, or by using the keyword search tool below to find specific information within the annual report.-
 1
1 -
2
-
3
-
4
-
5
-
6
-
7
-
8
-
9
-
10
-
11
-
12
-
13
-
14
-
15
-
16
-
17
-
18
-
19
-
20
-
21
-
22
-
23
-
24
-
25
-
26
-
27
-
28
-
29
-
30
-
31
-
32
-
33
-
34
-
35
-
36
-
37
-
38
-
39
-
40
-
 41
41 -
 42
42 -
 43
43 -
 44
44 -
 45
45 -
 46
46 -
 47
47 -
 48
48 -
 49
49 -
 50
50 -
 51
51 -
 52
52 -
 53
53 -
 54
54 -
 55
55 -
 56
56 -
 57
57 -
 58
58 -
 59
59 -
 60
60 -
 61
61 -
62
-
63
-
64
-
65
-
66
-
67
-
68
-
69
-
70
-
71
-
72
-
73
-
74
-
75
-
76
-
77
-
78
-
79
-
80
-
81
-
82
-
83
-
84
-
85
-
86
-
87
-
88
-
89
-
90
-
91
-
92
-
93
-
94
-
95
-
96
-
97
-
98
-
99
-
100
-
101
-
102
-
103
-
104
-
105
-
106
-
107
-
108
-
109
-
110
-
111
-
112
-
113
-
114
-
115
-
116
-
117
-
118
-
119
-
120
-
121
-
122
-
123
-
124
-
125
-
126
-
127
-
128
-
129
-
130
-
131
-
132
-
133
-
134
-
135
-
136
-
137
-
138
-
139
-
140
-
141
-
142
-
143
-
144
-
145
-
146
-
147
-
148
-
149
-
150
-
151
-
152
-
153
-
154
-
155
-
156
-
157
-
158
-
159
-
160
-
161
-
162
-
163
-
164
-
165
-
166
-
167
-
168
-
169
-
170
-
171
-
172
-
173
-
174
-
175
-
176
-
177
-
178
-
179
 |
 |
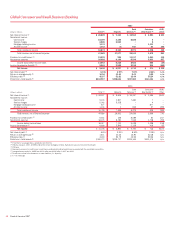
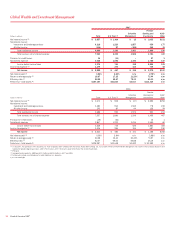
Consumer Real Estate
Consumer Real Estate generates revenue by providing an extensive line of
consumer real estate products and services to customers nationwide.
Consumer Real Estate products are available to our customers through a
retail network of personal bankers located in 6,149 banking centers,
mortgage loan officers in nearly 200 locations and through a sales force
offering our customers direct telephone and online access to our products.
Consumer Real Estate products include fixed and adjustable rate loans for
home purchase and refinancing needs, reverse mortgages, lines of credit
and home equity loans. Mortgage products are either sold into the secon-
dary mortgage market to investors, while retaining the Bank of America
customer relationships, or are held on our balance sheet for ALM pur-
poses. Consumer Real Estate is not impacted by the Corporation’s mort-
gage production retention decisions as Consumer Real Estate is
compensated for the decision on a management accounting basis with a
corresponding offset recorded in All Other.
The Consumer Real Estate business includes the origination, fulfill-
ment, sale and servicing of first mortgage loan products, reverse mortgage
products and home equity products. Servicing activities primarily include
collecting cash for principal, interest and escrow payments from bor-
rowers, disbursing customer draws for lines of credit and accounting for
and remitting principal and interest payments to investors and escrow
payments to third parties. Servicing income includes ancillary income
derived in connection with these activities such as late fees.
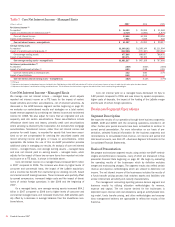
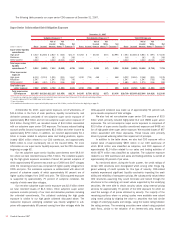
Within GCSBB, the Consumer Real Estate first mortgage and home
equity production were $93.3 billion and $69.2 billion for 2007 compared
to $76.9 billion and $67.9 billion in 2006. During the second quarter of
2007, the Corporation completed the purchase of a reverse mortgage
business which increased the Corporation’s offerings of reverse mort-
gages.
Net income for Consumer Real Estate decreased $341 million to
$371 million compared to 2006 as increases in mortgage banking income
and net interest income were more than offset by higher provision for
credit losses and an increase in noninterest expense. Net interest income
grew $287 million, or 14 percent, to $2.3 billion and was driven by loan
balances in our home equity business partially offset by spread com-
pression. Average loans and leases increased $20.7 billion, or 24 per-
cent. The increase in mortgage banking income of $456 million, or 52
percent, to $1.3 billion was primarily due to the election under SFAS 159
to account for certain mortgage loans held-for-sale at fair value, favorable
performance of the MSRs and increased production income partially offset
by widening of credit spreads during the year.
Subsequent to the adoption of SFAS 159 on January 1, 2007, mort-
gage loan origination fees and costs are recognized in earnings when
incurred. Previously, mortgage loan origination fees and costs would have
been capitalized as part of the carrying amount of the loans and recog-
nized as a reduction of mortgage banking income upon the sale of such
loans. For more information on the adoption of SFAS 159 on mortgage
banking income, see Mortgage Banking Risk Management on page 93.
Noninterest expense increased $315 million, or 18 percent, to $2.0
billion compared to 2006, driven by costs associated with increased
volume and the increase in cost related to the adoption of SFAS 159 as
discussed above.
Provision for credit losses increased $978 million to $1.0 billion
compared to 2006. This increase was driven by higher losses inherent in
the home equity portfolio reflective of portfolio seasoning and the impacts
of the weak housing market, particularly in geographic areas which have
experienced the most significant home price declines driving a reduction in
collateral value.
The Consumer Real Estate servicing portfolio includes loans serviced
for others, and originated and retained residential mortgages. The servic-
ing portfolio at December 31, 2007 was $516.9 billion, $97.4 billion
higher than at December 31, 2006, driven by production. Included in this
amount was $259.5 billion of residential first mortgage loans serviced for
others.
At December 31, 2007, the residential first mortgage MSR balance
was $3.1 billion, an increase of $184 million, or six percent, from
December 31, 2006. This value represented 118 bps of the related
unpaid principal balance, a seven bps decrease from December 31, 2006.
ALM/Other
ALM/Other is comprised primarily of the allocation of a portion of the
Corporation’s net interest income from ALM activities and the results of
other consumer-related businesses (e.g., insurance).
Net income increased $17 million compared to 2006 as higher con-
tributions from ALM activities were offset by increases in provision for
credit losses and noninterest expense. Provision for credit losses
increased $98 million to $315 million compared to 2006. This increase
was driven by higher losses inherent in the small business lending portfo-
lio managed outside of Card Services. For more information on the Corpo-
ration’s entire small business commercial – domestic portfolio, see
Commercial Portfolio Credit Risk Management beginning on page 74.
Bank of America 2007
49