Bank of America 2007 Annual Report Download - page 167
Download and view the complete annual report
Please find page 167 of the 2007 Bank of America annual report below. You can navigate through the pages in the report by either clicking on the pages listed below, or by using the keyword search tool below to find specific information within the annual report.-
 1
1 -
2
-
3
-
4
-
5
-
6
-
7
-
8
-
9
-
10
-
11
-
12
-
13
-
14
-
15
-
16
-
17
-
18
-
19
-
20
-
21
-
22
-
23
-
24
-
25
-
26
-
27
-
28
-
29
-
30
-
31
-
32
-
33
-
34
-
35
-
36
-
37
-
38
-
39
-
40
-
41
-
42
-
43
-
44
-
45
-
46
-
47
-
48
-
49
-
50
-
51
-
52
-
53
-
54
-
55
-
56
-
57
-
58
-
59
-
60
-
61
-
62
-
63
-
64
-
65
-
66
-
67
-
68
-
69
-
70
-
71
-
72
-
73
-
74
-
75
-
76
-
77
-
78
-
79
-
80
-
81
-
82
-
83
-
84
-
85
-
86
-
87
-
88
-
89
-
90
-
91
-
92
-
93
-
94
-
95
-
96
-
97
-
98
-
99
-
100
-
101
-
102
-
103
-
104
-
105
-
106
-
107
-
108
-
109
-
110
-
111
-
112
-
113
-
114
-
115
-
116
-
117
-
118
-
119
-
120
-
121
-
122
-
123
-
124
-
125
-
126
-
127
-
128
-
129
-
130
-
131
-
132
-
133
-
134
-
135
-
136
-
137
-
138
-
139
-
140
-
141
-
142
-
143
-
144
-
145
-
146
-
147
-
148
-
149
-
150
-
151
-
152
-
153
-
154
-
155
-
156
-
 157
157 -
 158
158 -
 159
159 -
 160
160 -
 161
161 -
 162
162 -
 163
163 -
 164
164 -
 165
165 -
 166
166 -
 167
167 -
 168
168 -
 169
169 -
 170
170 -
 171
171 -
 172
172 -
 173
173 -
 174
174 -
 175
175 -
 176
176 -
 177
177 -
178
-
179
 |
 |

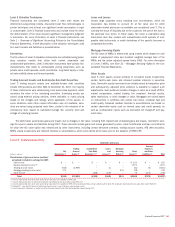
Level 3 Valuation Techniques
Financial instruments are considered Level 3 when their values are
determined using pricing models, discounted cash flow methodologies or
similar techniques and at least one significant model assumption or input
is unobservable. Level 3 financial instruments also include those for which
the determination of fair value requires significant management judgment
or estimation. For more information on Level 3 financial instruments, see
Note 1 – Summary of Significant Accounting Policies to the Consolidated
Financial Statements. A brief description of the valuation techniques used
for Level 3 assets and liabilities is provided below.
Derivatives
The fair values of Level 3 derivative instruments are estimated using propri-
etary valuation models that utilize both market observable and
unobservable parameters. Level 3 derivative instruments have primary risk
characteristics that relate to unobservable pricing parameters such as
private name credit spreads, credit correlations, long dated equity or inter-
est rate volatility skews and forward spreads.
Trading Account Assets and Available-for-Sale Debt Securities
Level 3 trading account assets and available-for-sale debt securities
include CDO positions and other ABS. At December 31, 2007, the majority
of these instruments were valued using a net asset value approach, which
considers the value of the underlying securities. Underlying assets are
valued using external pricing services, where available, or matrix pricing
based on the vintages and ratings, where applicable, of the assets. In
some situations when other market information was not available, secu-
rities are valued using projected cash flows, similar to the valuation of an
interest-only strip, based on estimated average life, seniority level and
vintage of underlying assets.
Loans and Leases
Certain large corporate loans including loan commitments, which the
Corporation has elected to account for at fair value and for which
observable market prices are not available, are considered Level 3. This is
normally the result of illiquidity due to the customer, the size of the loan or
the particular loan terms. In these cases, fair value is estimated using
discounted cash flow models with market-based credit spreads of com-
parable debt instruments or credit derivatives of the specific borrower or
comparable borrowers.
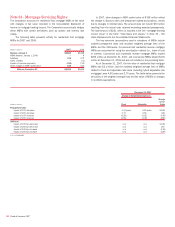
Mortgage Servicing Rights
The fair value of MSRs is determined using models which depend on esti-
mates of prepayment rates and resultant weighted average lives of the
MSRs and the option adjusted spread levels (OAS). For more information
on Level 3 MSRs, see Note 21 – Mortgage Servicing Rights to the Con-
solidated Financial Statements.
Other Assets
Level 3 other assets consist primarily of non-public equity investments,
certain held-for-sale loans and retained residual interests in securitiza-
tions. Non-public equity investments are initially valued at transaction price
and subsequently, adjusted when evidence is available to support such
adjustments. Such evidence includes changes in value as a result of IPOs,
market comparables, market liquidity, the investees’ financial results,
sales restrictions, or other changes in value. Mortgages are valued based
on instruments or portfolios with similar loan terms, collateral type and
credit quality. Retained residual interests in securitizations are based on
certain observable inputs such as interest rates and credit spreads, as
well as unobservable inputs such as estimated net charge-off and pay-
ment rates.
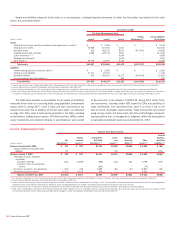
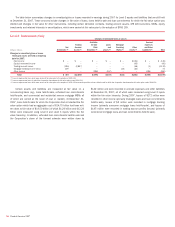
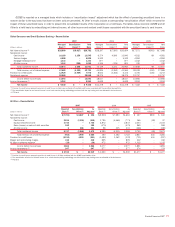
The table below summarizes gains and losses due to changes in fair value, including both realized and unrealized gains and losses, recorded in earn-
ings for Level 3 assets and liabilities during 2007. These amounts include gains and losses generated by loans, loans held-for-sale and loan commitments
for which the fair value option was elected and by other instruments, including certain derivative contracts, trading account assets, AFS debt securities,
MSRs, equity investments and retained interests in securitizations, which were carried at fair value prior to the adoption of SFAS 159.
Level 3 Instruments Only
Total Gains and Losses
(Dollars in millions)
Net
Derivatives
(1)
Trading
Account
Assets
(1)
Available-for-
Sale Debt
Securities
(1, 5)
Loans
and
Leases
(2)
Mortgage
Servicing
Rights
(1)
Other
Assets
(3)
Accrued
Expenses
and Other
Liabilities
(2)
Total
Classification of gains and losses (realized/
unrealized) included in earnings for 2007:
Card income $ – $ – $ – $ – $ – $ 103 $ – $ 103
Equity investment income
(4)
– – – – – 1,971 – 1,971
Trading account losses (515) (2,959) – (1) – (61) (5) (3,541)
Mortgage banking income (loss) 174 – – – 231 (29) – 376
Other income – – (398) (139) – 75 (274) (736)
Total
$(341) $(2,959) $(398) $(140) $231 $2,059 $(279) $(1,827)
(1) Amounts represented items which were carried at fair value prior to the adoption of SFAS 159.
(2) Amounts represented items for which the Corporation had elected the fair value option under SFAS 159.
(3) Amounts represented items which were carried at fair value prior to the adoption of SFAS 159 and certain portfolios of loans held-for-sale for which the Corporation had elected the fair value option under SFAS 159.
(4) During 2007, more than 90 percent of equity investment income’s Level 3 net gains were received in cash.
(5) Amount represents writedowns on certain securities that were deemed to be other-than-temporarily impaired during 2007.
Bank of America 2007
165