Bank of America 2007 Annual Report Download - page 96
Download and view the complete annual report
Please find page 96 of the 2007 Bank of America annual report below. You can navigate through the pages in the report by either clicking on the pages listed below, or by using the keyword search tool below to find specific information within the annual report.-
 1
1 -
2
-
3
-
4
-
5
-
6
-
7
-
8
-
9
-
10
-
11
-
12
-
13
-
14
-
15
-
16
-
17
-
18
-
19
-
20
-
21
-
22
-
23
-
24
-
25
-
26
-
27
-
28
-
29
-
30
-
31
-
32
-
33
-
34
-
35
-
36
-
37
-
38
-
39
-
40
-
41
-
42
-
43
-
44
-
45
-
46
-
47
-
48
-
49
-
50
-
51
-
52
-
53
-
54
-
55
-
56
-
57
-
58
-
59
-
60
-
61
-
62
-
63
-
64
-
65
-
66
-
67
-
68
-
69
-
70
-
71
-
72
-
73
-
74
-
75
-
76
-
77
-
78
-
79
-
80
-
81
-
82
-
83
-
84
-
85
-
 86
86 -
 87
87 -
 88
88 -
 89
89 -
 90
90 -
 91
91 -
 92
92 -
 93
93 -
 94
94 -
 95
95 -
 96
96 -
 97
97 -
 98
98 -
 99
99 -
 100
100 -
 101
101 -
 102
102 -
 103
103 -
 104
104 -
 105
105 -
 106
106 -
107
-
108
-
109
-
110
-
111
-
112
-
113
-
114
-
115
-
116
-
117
-
118
-
119
-
120
-
121
-
122
-
123
-
124
-
125
-
126
-
127
-
128
-
129
-
130
-
131
-
132
-
133
-
134
-
135
-
136
-
137
-
138
-
139
-
140
-
141
-
142
-
143
-
144
-
145
-
146
-
147
-
148
-
149
-
150
-
151
-
152
-
153
-
154
-
155
-
156
-
157
-
158
-
159
-
160
-
161
-
162
-
163
-
164
-
165
-
166
-
167
-
168
-
169
-
170
-
171
-
172
-
173
-
174
-
175
-
176
-
177
-
178
-
179
 |
 |
have used the factors that we believe represent the most reasonable
value in developing the inputs. Actual performance that differs from our
estimates of the key variables could impact net income. Separate from the
possible future impact to net income from input and model variables, the
value of our lending portfolio and market-sensitive assets and liabilities
may change subsequent to the balance sheet measurement, often sig-
nificantly, due to the nature and magnitude of future credit and market
conditions. Such credit and market conditions may change quickly and in
unforeseen ways and the resulting volatility could have a significant, neg-
ative effect on future operating results. These fluctuations would not be
indicative of deficiencies in our models or inputs.
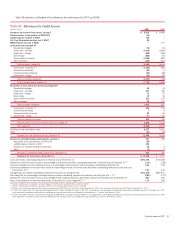
Allowance for Credit Losses
The allowance for credit losses, which includes the allowance for loan and
lease losses and the reserve for unfunded lending commitments, repre-
sents management’s estimate of probable losses inherent in the Corpo-
ration’s lending activities that are carried at historical cost. Changes to the
allowance for credit losses are reported in the Consolidated Statement of
Income in the provision for credit losses. Our process for determining the
allowance for credit losses is discussed in the Credit Risk Management
section beginning on page 69 and Note 1 – Summary of Significant
Accounting Principles to the Consolidated Financial Statements. Due to
the variability in the drivers of the assumptions made in this process,
estimates of the portfolio’s inherent risks and overall collectibility change
with changes in the economy, individual industries, countries and
individual borrowers’ or counterparties’ ability and willingness to repay
their obligations. The degree to which any particular assumption affects
the allowance for credit losses depends on the severity of the change and
its relationship to the other assumptions.
Key judgments used in determining the allowance for credit losses
include: (i) risk ratings for pools of commercial loans and leases,
(ii) market and collateral values and discount rates for individually eval-
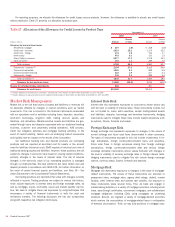
uated loans, (iii) product type classifications for consumer and commercial
loans and leases, (iv) loss rates used for consumer and commercial loans
and leases, (v) adjustments made to assess current events and con-
ditions, (vi) considerations regarding domestic and global economic
uncertainty, and (vii) overall credit conditions.
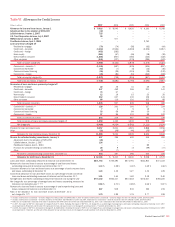
Our allowance for loan and lease losses is sensitive to the risk rating
assigned to commercial loans and leases. Assuming a downgrade of one
level in the internal risk rating for commercial loans and leases measured
at historical cost and rated under the internal risk rating scale, except
loans and leases already risk-rated Doubtful as defined by regulatory
authorities, the allowance for loans and lease losses would increase by
approximately $1.6 billion at December 31, 2007. The allowance for loan
and lease losses as a percentage of total loans and leases measured at
historical cost at December 31, 2007 was 1.33 percent and this hypo-
thetical increase in the allowance would raise the ratio to approximately
1.50 percent. Our allowance for loans and lease losses is also sensitive
to the loss rates used for the consumer and commercial portfolios. A 10
percent increase in the loss rates used on the consumer and commercial
loan and lease portfolios measured at historical cost would increase the
allowance for loan and lease losses at December 31, 2007 by approx-
imately $820 million, of which $690 million would relate to consumer and
$130 million to commercial.
These sensitivity analyses do not represent management’s expect-
ations of the deterioration in risk ratings or the increases in loss rates but
are provided as hypothetical scenarios to assess the sensitivity of the
allowance for loan and lease losses to changes in key inputs. We believe
the risk ratings and loss severities currently in use are appropriate and
that the probability of a downgrade of one level of the internal risk ratings
for commercial loans and leases within a short period of time is remote.
The process of determining the level of the allowance for credit
losses requires a high degree of judgment. It is possible that others, given
the same information, may at any point in time reach different reasonable
conclusions.
Fair Value of Financial Instruments
Effective January 1, 2007, we determined the fair market values of our
financial instruments based on the fair value hierarchy established in
SFAS 157 which requires an entity to maximize the use of observable
inputs and minimize the use of unobservable inputs when measuring fair
value. The standard describes three levels of inputs that may be used to
measure fair value. We carry certain corporate loans and loan commit-
ments, loans held-for-sale, structured reverse repurchase agreements, and
long-term deposits at fair value in accordance with SFAS 159. We also
carry trading account assets and liabilities, derivative assets and
liabilities, AFS debt and marketable equity securities, MSRs, and certain
other assets at fair value. For more information, see Note 1 – Summary of
Significant Accounting Principles and Note 19 – Fair Value Disclosures to
the Consolidated Financial Statements.
Trading account assets and liabilities are recorded at fair value,
which is primarily based on actively traded markets where prices are
based on either direct market quotes or observed transactions. Liquidity is
a significant factor in the determination of the fair value of trading account
assets or liabilities. Market price quotes may not be readily available for
some positions, or positions within a market sector where trading activity
has slowed significantly or ceased. Situations of illiquidity generally are
triggered by the market’s perception of credit uncertainty regarding a sin-
gle company or a specific market sector. In these instances, fair value is
determined based on limited available market information and other fac-
tors, principally from reviewing the issuer’s financial statements and
changes in credit ratings made by one or more rating agencies. At
December 31, 2007, $4.0 billion, or two percent, of trading account
assets were classified as level 3 fair value assets. No trading account
liabilities were classified as level 3 liabilities at December 31, 2007.
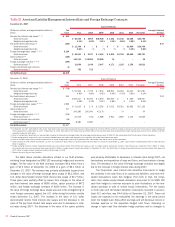
The fair values of derivative assets and liabilities include adjust-
ments for market liquidity, counterparty credit quality and other deal
specific factors, where appropriate. To ensure the prudent application of
estimates and management judgment in determining the fair value of
derivative assets and liabilities, various processes and controls have been
adopted, which include: a model validation policy that requires a review
and approval of quantitative models used for deal pricing, financial state-
ment fair value determination and risk quantification; a trading product
valuation policy that requires verification of all traded product valuations;
and a periodic review and substantiation of daily profit and loss reporting
for all traded products. These processes and controls are performed
independently of the business.
The fair values of derivative assets and liabilities traded in the
over-the-counter market are determined using quantitative models that
require the use of multiple market inputs including interest rates, prices
and indices to generate continuous yield or pricing curves and volatility
factors, which are used to value the position. The predominance of market
inputs are actively quoted and can be validated through external sources,
including brokers, market transactions and third-party pricing services.
Estimation risk is greater for derivative asset and liability positions that
are either option-based or have longer maturity dates where observable
market inputs are less readily available or are unobservable, in which case
94
Bank of America 2007