Bank of America 2007 Annual Report Download - page 141
Download and view the complete annual report
Please find page 141 of the 2007 Bank of America annual report below. You can navigate through the pages in the report by either clicking on the pages listed below, or by using the keyword search tool below to find specific information within the annual report.-
 1
1 -
2
-
3
-
4
-
5
-
6
-
7
-
8
-
9
-
10
-
11
-
12
-
13
-
14
-
15
-
16
-
17
-
18
-
19
-
20
-
21
-
22
-
23
-
24
-
25
-
26
-
27
-
28
-
29
-
30
-
31
-
32
-
33
-
34
-
35
-
36
-
37
-
38
-
39
-
40
-
41
-
42
-
43
-
44
-
45
-
46
-
47
-
48
-
49
-
50
-
51
-
52
-
53
-
54
-
55
-
56
-
57
-
58
-
59
-
60
-
61
-
62
-
63
-
64
-
65
-
66
-
67
-
68
-
69
-
70
-
71
-
72
-
73
-
74
-
75
-
76
-
77
-
78
-
79
-
80
-
81
-
82
-
83
-
84
-
85
-
86
-
87
-
88
-
89
-
90
-
91
-
92
-
93
-
94
-
95
-
96
-
97
-
98
-
99
-
100
-
101
-
102
-
103
-
104
-
105
-
106
-
107
-
108
-
109
-
110
-
111
-
112
-
113
-
114
-
115
-
116
-
117
-
118
-
119
-
120
-
121
-
122
-
123
-
124
-
125
-
126
-
127
-
128
-
129
-
130
-
 131
131 -
 132
132 -
 133
133 -
 134
134 -
 135
135 -
 136
136 -
 137
137 -
 138
138 -
 139
139 -
 140
140 -
 141
141 -
 142
142 -
 143
143 -
 144
144 -
 145
145 -
 146
146 -
 147
147 -
 148
148 -
 149
149 -
 150
150 -
 151
151 -
152
-
153
-
154
-
155
-
156
-
157
-
158
-
159
-
160
-
161
-
162
-
163
-
164
-
165
-
166
-
167
-
168
-
169
-
170
-
171
-
172
-
173
-
174
-
175
-
176
-
177
-
178
-
179
 |
 |

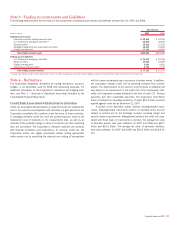
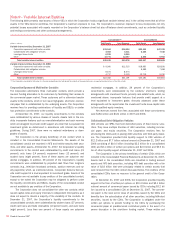
options are recorded as derivatives on the Consolidated Balance Sheet
and are carried at fair value with changes in fair value recorded in trading
account profits (losses). See Note 13 – Commitments and Contingencies
to the Consolidated Financial Statements for more information on the writ-
ten put options. Derivative activity related to these entities is included in
Note 4 – Derivatives to the Consolidated Financial Statements.
The Corporation also administers a CDO conduit that obtains funds
by issuing commercial paper to third party investors. The conduit held
$2.3 billion and $5.5 billion of assets at December 31, 2007 and 2006
consisting of super senior tranches of debt securities issued by other
CDOs. These securities benefit from overcollateralization exceeding the
amount that would be required for a AAA-rating. The Corporation provides
liquidity support equal to the amount of assets in this conduit which obli-
gates it to purchase the commercial paper at a predetermined contractual
yield in the event of a severe disruption in the short-term funding market.
At December 31, 2007, the Corporation held $6.6 billion of commer-
cial paper on the balance sheet that was issued by unconsolidated CDO
vehicles, of which $5.0 billion related to these written put options and
$1.6 billion related to other liquidity support. The Corporation recorded
losses of $3.5 billion, net of insurance, in 2007 (of which $3.2 billion was
recorded in trading account profits (losses) and $288 million was recorded
in other income) due to writedowns of assets in consolidated CDOs and
losses recorded in connection with written put options and liquidity
commitments to unconsolidated CDOs. No losses were recorded in 2006.
Net revenues earned from fees associated with these liquidity com-
mitments were $5 million and $3 million in 2007 and 2006.
Leveraged Lease Trusts
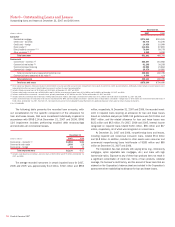
The Corporation’s net investment in leveraged lease trusts totaled $6.2
billion and $8.6 billion at December 31, 2007 and 2006. These amounts,
which were recorded in loans and leases, represent the Corporation’s
maximum loss exposure to these entities in the unlikely event that the
leveraged lease investments become worthless. Debt issued by the lever-
aged lease trusts is nonrecourse to the Corporation. The Corporation has
no liquidity exposure to these leveraged lease trusts.
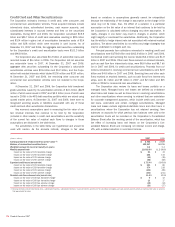
Other
Other consolidated VIEs at December 31, 2007 and 2006 consisted primarily
of securitization vehicles, including an asset acquisition conduit that holds
securities on the Corporation’s behalf and term securitization vehicles that
did not meet QSPE status, as well as managed investment vehicles that
invest in financial assets, primarily debt securities. The Corporation’s max-
imum exposure to loss of these VIEs included $7.4 billion and $272 million
of liquidity exposure to consolidated trusts that hold municipal bonds and
$1.6 billion and $1.1 billion of liquidity exposure to the consolidated asset
acquisition conduit at December 31, 2007 and 2006. The assets of these
consolidated VIEs were recorded in trading account assets, AFS debt secu-
rities and other assets. Other unconsolidated VIEs at December 31, 2007
and 2006 consisted primarily of securitization vehicles, managed investment
vehicles that invest in financial assets, primarily debt securities, and invest-
ments in affordable housing investment partnerships. Revenues associated
with administration, asset management, liquidity, and other services were
$17 million and $20 million in 2007 and 2006.
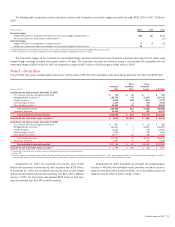
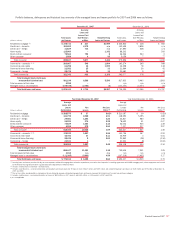
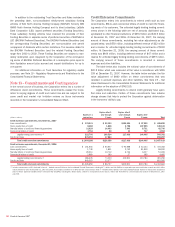
Note 10 – Goodwill and Intangible Assets
The following tables present goodwill and intangible assets at December 31, 2007 and 2006.
December 31
(Dollars in millions) 2007 2006
Global Consumer and Small Business Banking
$40,340
$38,201
Global Corporate and Investment Banking
29,648
21,979
Global Wealth and Investment Management
6,451
5,243
All Other
1,091
239
Total goodwill
$77,530
$65,662
The gross carrying values and accumulated amortization related to intangible assets at December 31, 2007 and 2006 are presented below:
December 31
2007 2006
(Dollars in millions)
Gross Carrying
Value
Accumulated
Amortization
Gross Carrying
Value
Accumulated
Amortization
Purchased credit card relationships
$ 7,027 $1,970
$ 6,790 $1,159
Core deposit intangibles
4,594 2,828
3,850 2,396
Affinity relationships
1,681 406
1,650 205
Other intangibles
3,050 852
1,525 633
Total intangible assets
$16,352 $6,056
$13,815 $4,393
The above tables include $11.1 billion and $1.6 billion of goodwill
and $1.0 billion and $1.3 billion of intangible assets related to the
preliminary purchase price allocations of LaSalle and U.S. Trust Corpo-
ration. For more information on the impact of these acquisitions, see Note
2 – Merger and Restructuring Activity to the Consolidated Financial State-
ments.
Amortization of intangibles expense was $1.7 billion, $1.8 billion and
$809 million in 2007, 2006 and 2005, respectively. The Corporation
estimates aggregate amortization expense will be approximately $1.7 bil-
lion, $1.5 billion, $1.5 billion, $1.2 billion and $1.0 billion for 2008
through 2012, respectively. These estimates exclude the impact of any
planned acquisitions.
Bank of America 2007
139