Bank of America 2007 Annual Report Download - page 81
Download and view the complete annual report
Please find page 81 of the 2007 Bank of America annual report below. You can navigate through the pages in the report by either clicking on the pages listed below, or by using the keyword search tool below to find specific information within the annual report.-
 1
1 -
2
-
3
-
4
-
5
-
6
-
7
-
8
-
9
-
10
-
11
-
12
-
13
-
14
-
15
-
16
-
17
-
18
-
19
-
20
-
21
-
22
-
23
-
24
-
25
-
26
-
27
-
28
-
29
-
30
-
31
-
32
-
33
-
34
-
35
-
36
-
37
-
38
-
39
-
40
-
41
-
42
-
43
-
44
-
45
-
46
-
47
-
48
-
49
-
50
-
51
-
52
-
53
-
54
-
55
-
56
-
57
-
58
-
59
-
60
-
61
-
62
-
63
-
64
-
65
-
66
-
67
-
68
-
69
-
70
-
 71
71 -
 72
72 -
 73
73 -
 74
74 -
 75
75 -
 76
76 -
 77
77 -
 78
78 -
 79
79 -
 80
80 -
 81
81 -
 82
82 -
 83
83 -
 84
84 -
 85
85 -
 86
86 -
 87
87 -
 88
88 -
 89
89 -
 90
90 -
 91
91 -
92
-
93
-
94
-
95
-
96
-
97
-
98
-
99
-
100
-
101
-
102
-
103
-
104
-
105
-
106
-
107
-
108
-
109
-
110
-
111
-
112
-
113
-
114
-
115
-
116
-
117
-
118
-
119
-
120
-
121
-
122
-
123
-
124
-
125
-
126
-
127
-
128
-
129
-
130
-
131
-
132
-
133
-
134
-
135
-
136
-
137
-
138
-
139
-
140
-
141
-
142
-
143
-
144
-
145
-
146
-
147
-
148
-
149
-
150
-
151
-
152
-
153
-
154
-
155
-
156
-
157
-
158
-
159
-
160
-
161
-
162
-
163
-
164
-
165
-
166
-
167
-
168
-
169
-
170
-
171
-
172
-
173
-
174
-
175
-
176
-
177
-
178
-
179
 |
 |

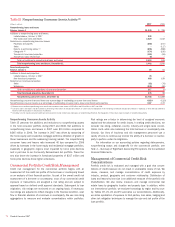
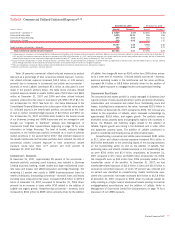
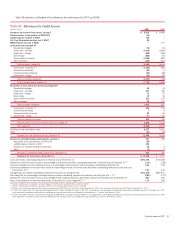
Nonperforming Commercial Assets Activity
Table 20 presents the additions and reductions to nonperforming assets in the commercial portfolio during 2007 and 2006. The increase in nonaccrual
loans and leases for 2007 was primarily attributable to homebuilder and mortgage company exposure, and the addition of LaSalle.
Table 20 Nonperforming Commercial Assets Activity (1, 2)
(Dollars in millions) 2007 2006
Nonperforming loans and leases
Balance, January 1
$ 757
$ 726
Additions to nonperforming loans and leases:
LaSalle balance, October 1, 2007
413
–
New nonaccrual loans and leases
2,467
980
Advances
85
32
Reductions in nonperforming loans and leases:
Paydowns and payoffs
(781)
(403)
Sales
(82)
(152)
Returns to performing status
(3)
(239)
(80)
Charge-offs
(4)
(370)
(331)
Transfers to foreclosed properties
(75)
(3)
Transfers to loans held-for-sale
(20)
(12)
Total net additions to nonperforming loans and leases
1,398
31
Total nonperforming loans and leases, December 31
2,155
757
Foreclosed properties
Balance, January 1
10
31
Additions to foreclosed properties:
LaSalle balance, October 1, 2007
16
–
New foreclosed properties
75
6
Reductions in foreclosed properties:
Sales
(22)
(18)
Writedowns
(4)
(9)
Total net additions to (reductions in) foreclosed properties
65
(21)
Total foreclosed properties, December 31
75
10
Nonperforming commercial assets, December 31
$2,230
$ 767
Nonperforming commercial loans and leases as a percentage of outstanding commercial loans and leases measured at historical cost
0.67%
0.31%
Nonperforming commercial assets as a percentage of outstanding commercial loans and leases measured at historical cost and foreclosed properties
0.70
0.32
(1) Balances do not include nonperforming loans held-for-sale included in other assets of $93 million and $50 million in 2007 and 2006. There were no nonperforming loans measured at fair value in accordance with SFAS 159 in
2007. See Note 19 – Fair Value Disclosures to the Consolidated Financial Statements for a discussion of the changes in the fair value portfolio during 2007.
(2) Includes small business commercial – domestic activity.
(3) Commercial loans and leases may be restored to performing status when all principal and interest is current and full repayment of the remaining contractual principal and interest is expected, or when the loan otherwise
becomes well-secured and is in the process of collection.
(4) Certain loan and lease products, including business card, are not classified as nonperforming; therefore, the charge-offs on these loans have no impact on nonperforming activity.
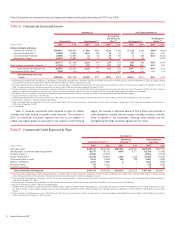
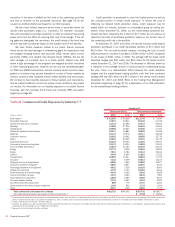
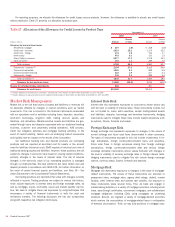
Industry Concentrations
Table 21 presents commercial committed and commercial utilized credit
exposure by industry and the total net credit default protection purchased
to cover the funded and the unfunded portion of certain credit exposure.
Our commercial credit exposure is diversified across a broad range of
industries.
Industry limits are used internally to manage industry concentrations
and are based on committed exposure and capital usage that are allo-
cated on an industry-by-industry basis. A risk management framework is in
place to set and approve industry limits, as well as to provide ongoing
monitoring. The CRC oversees industry limits governance.
Total commercial committed credit exposure increased by $167.9
billion, or 27 percent, in 2007 compared to 2006, with $86.6 billion, or
52 percent of the increase, attributable to LaSalle. Total commercial uti-
lized credit exposure increased by $108.4 billion, or 31 percent, in 2007
compared to 2006, with $57.6 billion, or 53 percent, of the increase
attributable to LaSalle. The overall commercial credit utilization rate was
largely unchanged year over year, increasing from 56 percent to 57 per-
cent.
Real estate remains our largest industry concentration, accounting
for 14 percent of total commercial committed exposure at December 31,
2007. Growth of $38.2 billion, or 52 percent, was driven primarily by
LaSalle, which contributed $27.0 billion. Diversified financials grew by
$19.1 billion, or 28 percent, due to a combination of increased activity in
interest rate products, client transactions booked in the bank sponsored
multi-seller conduits, and LaSalle. Government and public education
exposure increased $18.2 billion, or 46 percent, due primarily to financing
commitments to student lenders. Retailing exposure grew by $11.1 billion,
or 25 percent, principally due to LaSalle. Capital goods grew by $15.0 bil-
Monolines exposure is reported in the insurance industry and man-
aged under the insurance portfolio industry limits. Direct commercial
committed exposure to monolines, consisted of revolvers of $203 million
and net mark-to-market derivative exposure, of $420 million at
December 31, 2007.
We have indirect exposure to monolines primarily in the form of guar-
antees supporting our loans, investment portfolios, securitizations, credit
enhanced securities as part of our public finance business and other
selected products. Such indirect exposure exists when we purchase credit
protection from monolines to hedge all or a portion of the credit risk on
certain credit exposures including loans and CDOs. We underwrite our
public finance exposure by evaluating the underlying
Bank of America 2007
79
lion, or 40 percent, attributed equally to organic growth and LaSalle.