Bank of America 2007 Annual Report Download - page 133
Download and view the complete annual report
Please find page 133 of the 2007 Bank of America annual report below. You can navigate through the pages in the report by either clicking on the pages listed below, or by using the keyword search tool below to find specific information within the annual report.-
 1
1 -
2
-
3
-
4
-
5
-
6
-
7
-
8
-
9
-
10
-
11
-
12
-
13
-
14
-
15
-
16
-
17
-
18
-
19
-
20
-
21
-
22
-
23
-
24
-
25
-
26
-
27
-
28
-
29
-
30
-
31
-
32
-
33
-
34
-
35
-
36
-
37
-
38
-
39
-
40
-
41
-
42
-
43
-
44
-
45
-
46
-
47
-
48
-
49
-
50
-
51
-
52
-
53
-
54
-
55
-
56
-
57
-
58
-
59
-
60
-
61
-
62
-
63
-
64
-
65
-
66
-
67
-
68
-
69
-
70
-
71
-
72
-
73
-
74
-
75
-
76
-
77
-
78
-
79
-
80
-
81
-
82
-
83
-
84
-
85
-
86
-
87
-
88
-
89
-
90
-
91
-
92
-
93
-
94
-
95
-
96
-
97
-
98
-
99
-
100
-
101
-
102
-
103
-
104
-
105
-
106
-
107
-
108
-
109
-
110
-
111
-
112
-
113
-
114
-
115
-
116
-
117
-
118
-
119
-
120
-
121
-
122
-
 123
123 -
 124
124 -
 125
125 -
 126
126 -
 127
127 -
 128
128 -
 129
129 -
 130
130 -
 131
131 -
 132
132 -
 133
133 -
 134
134 -
 135
135 -
 136
136 -
 137
137 -
 138
138 -
 139
139 -
 140
140 -
 141
141 -
 142
142 -
 143
143 -
144
-
145
-
146
-
147
-
148
-
149
-
150
-
151
-
152
-
153
-
154
-
155
-
156
-
157
-
158
-
159
-
160
-
161
-
162
-
163
-
164
-
165
-
166
-
167
-
168
-
169
-
170
-
171
-
172
-
173
-
174
-
175
-
176
-
177
-
178
-
179
 |
 |

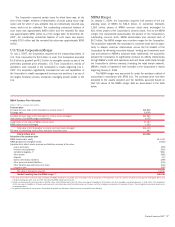
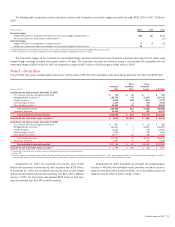
The following table summarizes certain information related to the Corporation’s derivative hedges accounted for under SFAS 133 for 2007, 2006 and
2005.
(Dollars in millions) 2007 2006 2005
Fair value hedges
Hedge ineffectiveness recognized in net interest income and mortgage banking income
(1)
$55
$23 $166
Net loss excluded from assessment of effectiveness
(2)
– – (13)
Cash flow hedges
Hedge ineffectiveness recognized in net interest income
4
18 (31)
Net gains on transactions which are probable of not occurring recognized in other income
18
––
(1) Hedge ineffectiveness was recognized in net interest income in 2007 and 2006 and net interest income and mortgage banking income in 2005.
(2) Net loss excluded from assessment of effectiveness was recorded primarily within mortgage banking income in 2005.
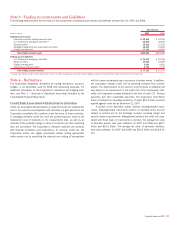
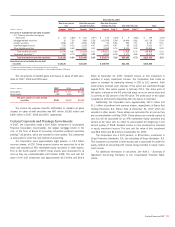
The Corporation hedges its net investment in consolidated foreign operations determined to have functional currencies other than the U.S. dollar using
forward foreign exchange contracts that typically settle in 90 days. The Corporation recorded net derivative losses in accumulated OCI associated with net
investment hedges of $516 million for 2007 as compared to losses of $475 million in 2006 and gains of $66 million in 2005.
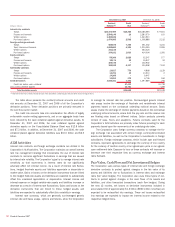
Note 5 – Securities
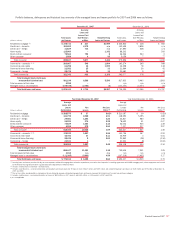
The amortized cost, gross unrealized gains and losses, and fair value of AFS debt and marketable equity securities at December 31, 2007 and 2006 were:
(Dollars in millions)
Amortized
Cost
Gross
Unrealized
Gains
Gross
Unrealized
Losses Fair Value
Available-for-sale debt securities, December 31, 2007
U.S. Treasury securities and agency debentures
$ 749 $ 10 $ – $ 759
Mortgage-backed securities
(1)
166,768 92 (3,144) 163,716
Foreign securities
6,568 290 (101) 6,757
Corporate/Agency bonds
3,107 2 (76) 3,033
Other taxable securities
(2)
24,608 69 (84) 24,593
Total taxable securities
201,800 463 (3,405) 198,858
Tax-exempt securities
14,468 73 (69) 14,472
Total available-for-sale debt securities
$216,268 $ 536 $(3,474) $213,330
Available-for-sale marketable equity securities (3)
$ 6,562 $13,530 $ (352) $ 19,740
Available-for-sale debt securities, December 31, 2006
U.S. Treasury securities and agency debentures $ 697 $ – $ (9) $ 688
Mortgage-backed securities
(1)
161,693 4 (4,804) 156,893
Foreign securities 12,126 2 (78) 12,050
Corporate/Agency bonds 4,699 – (96) 4,603
Other taxable securities
(2)
12,077 10 (38) 12,049
Total taxable securities 191,292 16 (5,025) 186,283
Tax-exempt securities 6,493 64 (34) 6,523
Total available-for-sale debt securities $197,785 $ 80 $(5,059) $192,806
Available-for-sale marketable equity securities (3) $ 2,799 $ 408 $ (10) $ 3,197
(1) Substantially all securities were issued by U.S. government-backed or government-sponsored enterprises.
(2) Includes ABS.
(3) Represents those AFS marketable equity securities that are recorded in other assets on the Consolidated Balance Sheet. At December 31, 2007, approximately $16.2 billion of the fair value balance, including $13.4 billion of
unrealized gain, represents China Construction Bank (CCB) shares. At December 31, 2006 these CCB shares were accounted for at cost and therefore excluded from this table.
At December 31, 2007, the amortized cost and fair value of both
taxable and tax-exempt held-to-maturity debt securities was $726 million.
At December 31, 2006, the amortized cost and fair value of both taxable
and tax-exempt held-to-maturity debt securities was $40 million. Effective
January 1, 2007, the Corporation redesignated $909 million of debt secu-
rities at amortized cost from AFS to held-to-maturity.
At December 31, 2007 and 2006, accumulated net unrealized gains
(losses) on AFS debt and marketable equity securities included in accumu-
lated OCI were $6.6 billion and $(2.9) billion, net of the related income tax
(expense) benefit of $(3.7) billion and $1.7 billion.
Bank of America 2007
131