Bank of America 2007 Annual Report Download - page 54
Download and view the complete annual report
Please find page 54 of the 2007 Bank of America annual report below. You can navigate through the pages in the report by either clicking on the pages listed below, or by using the keyword search tool below to find specific information within the annual report.-
 1
1 -
2
-
3
-
4
-
5
-
6
-
7
-
8
-
9
-
10
-
11
-
12
-
13
-
14
-
15
-
16
-
17
-
18
-
19
-
20
-
21
-
22
-
23
-
24
-
25
-
26
-
27
-
28
-
29
-
30
-
31
-
32
-
33
-
34
-
35
-
36
-
37
-
38
-
39
-
40
-
41
-
42
-
43
-
 44
44 -
 45
45 -
 46
46 -
 47
47 -
 48
48 -
 49
49 -
 50
50 -
 51
51 -
 52
52 -
 53
53 -
 54
54 -
 55
55 -
 56
56 -
 57
57 -
 58
58 -
 59
59 -
 60
60 -
 61
61 -
 62
62 -
 63
63 -
 64
64 -
65
-
66
-
67
-
68
-
69
-
70
-
71
-
72
-
73
-
74
-
75
-
76
-
77
-
78
-
79
-
80
-
81
-
82
-
83
-
84
-
85
-
86
-
87
-
88
-
89
-
90
-
91
-
92
-
93
-
94
-
95
-
96
-
97
-
98
-
99
-
100
-
101
-
102
-
103
-
104
-
105
-
106
-
107
-
108
-
109
-
110
-
111
-
112
-
113
-
114
-
115
-
116
-
117
-
118
-
119
-
120
-
121
-
122
-
123
-
124
-
125
-
126
-
127
-
128
-
129
-
130
-
131
-
132
-
133
-
134
-
135
-
136
-
137
-
138
-
139
-
140
-
141
-
142
-
143
-
144
-
145
-
146
-
147
-
148
-
149
-
150
-
151
-
152
-
153
-
154
-
155
-
156
-
157
-
158
-
159
-
160
-
161
-
162
-
163
-
164
-
165
-
166
-
167
-
168
-
169
-
170
-
171
-
172
-
173
-
174
-
175
-
176
-
177
-
178
-
179
 |
 |

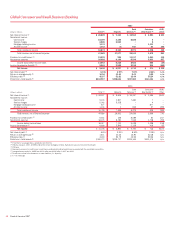
seasoning and deterioration, and the level of commercial recoveries
declined.
Noninterest expense increased $111 million, or five percent, primar-
ily due to the LaSalle merger.
Capital Markets and Advisory Services
CMAS provides financial products, advisory services and financing globally
to our institutional investor clients in support of their investing and trading
activities. We also work with our commercial and corporate issuer clients
to provide debt and equity underwriting and distribution capabilities,
merger-related advisory services and risk management solutions using
interest rate, equity, credit, currency and commodity derivatives, foreign
exchange, fixed income and mortgage-related products. The business may
take positions in these products and participate in market-making activ-
ities dealing in government securities, equity and equity-linked securities,
high-grade and high-yield corporate debt securities, commercial paper,
mortgage-backed securities and ABS. Underwriting debt and equity, secu-
rities research and certain market-based activities are executed through
Banc of America Securities, LLC which is a primary dealer in the U.S.
In January 2008, we announced changes in our CMAS business
which better align the strategy of this business with GCIB’s broader
integrated platform. We will continue to provide corporate, commercial and
sponsored clients with debt and equity capital-raising services, strategic
advice, and a full range of corporate banking capabilities. We will reduce
activities in certain structured products (e.g., CDOs) and will resize the
international platform to emphasize debt, cash management, and trading
services, including rates and foreign exchange. The realignment will result
in the reduction of front office personnel with additional infrastructure
headcount reduction to follow. We also plan to sell our equity prime
brokerage business.
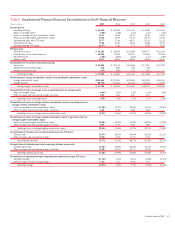
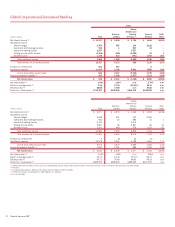
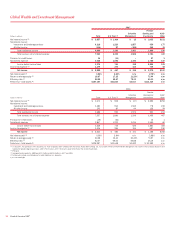
CMAS evaluates its results using market-based revenue that is
comprised of net interest income and noninterest income. The following
table presents further detail regarding market-based revenue. Sales and
trading revenue is segregated into fixed income from liquid products
(primarily interest rate and commodity derivatives, foreign exchange con-
tracts and public finance), credit products (primarily investment and non-
investment grade corporate debt obligations and credit derivatives),
structured products (primarily CMBS, residential mortgage-backed secu-
rities, structured credit trading and CDOs), and equity income from equity-
linked derivatives and cash equity activity.
(Dollars in millions) 2007 2006
Investment banking income
Advisory fees
$ 446
$ 337
Debt underwriting
1,772
1,824
Equity underwriting
319
315
Total investment banking income
2,537
2,476
Sales and trading revenue
Fixed income:
Liquid products
2,111
2,158
Credit products
(537)
821
Structured products
(5,176)
1,449
Total fixed income
(3,602)
4,428
Equity income
1,298
1,571
Total sales and trading revenue
(2,304)
5,999
Total Capital Markets and Advisory Services
market-based revenue
(1)
$ 233
$8,475
(1) CMAS revenue of $303 million for 2007 consists of market-based revenue of $233 million and $70
million of net interest income on loans for which the fair value option has been elected.
A variety of factors influence results including volume of activity, the
degree in which we successfully anticipate market movements, and how
our hedges perform in the various markets. During the second half of
2007, extreme dislocations emerged in the financial markets, including
leveraged finance, subprime mortgage, and the commercial paper mar-
kets, and these dislocations were further compounded by the decoupling
of typical correlations in the various markets in which we participate.
These conditions created less liquidity, a flight to quality, greater volatility,
widening of credit spreads and a lack of price transparency. Furthermore,
in the fourth quarter of 2007, the credit ratings of certain structured secu-
rities (e.g., CDOs) were downgraded which among other things triggered
further widening of credit spreads for this type of security. We have been
an active participant in the CDO market, maintain ongoing exposure to
these securities and incurred losses associated with these exposures.
Many of these conditions continued into 2008 and it is unclear how long
these conditions and the overall economic slowdown may continue and
what impact they will ultimately have on our results.
CMAS recognized a net loss of $3.4 billion in 2007, a decrease of
$5.0 billion, compared to 2006 driven by a decrease in market-based
revenue of $8.2 billion. The decrease was driven by $5.6 billion of losses
resulting from our CDO exposure and other trading losses. Partially off-
setting this decrease was a reduction in noninterest expense due to lower
performance-based incentive compensation.
Investment banking income increased $61 million to $2.5 billion due
to growth in advisory fees. This growth was driven by increased market
activity primarily in the first half of the year partially offset by reduced debt
underwriting fees that were affected by the market disruptions during the
second half of the year which included the utilization of fees to distribute
leveraged loan commitments.
Sales and trading revenue declined $8.3 billion to a loss of $2.3 bil-
lion in 2007. While structured products and credit products reported
losses for 2007, liquid products and equities compared reasonably well
with 2006 given the market conditions.
ŠLiquid products revenue decreased $47 million as the negative impact
of spread widening and correlations breaking down (e.g., correlation
between certain municipal market indices and bond market swap
spreads) were partially offset by the strength in interest rate products
and foreign exchange contracts.
ŠCredit products losses were $537 million, a decline in revenue of $1.4
billion compared to 2006. Losses resulted from positions taken in the
market as a result of customer market making activities as the widening
of spreads during the second half of the year had a negative impact on
these positions. In addition, certain indices became extremely volatile
and diverged from other related indices and from single name credit risk
(bonds, loans or derivatives) in our portfolio. This negatively impacted
our hedging of portfolios of single name credits with derivatives based
on these indices. One example of this divergence was the widening of
the spread between the investment grade cash and the credit derivative
markets. In addition, losses also resulted from positions taken in the
market as the widening of spreads during the second half of the year
had a negative impact on these positions.
We also incurred losses of $292 million, net of $471 million of fees,
on leveraged loans, loan commitments and the Corporation’s share of
the leveraged forward calendar. Losses incurred on our leveraged
exposure were not concentrated in any one type (senior secured, cove-
nant light or subordinated/senior unsecured) and were generally due to
wider new issuance credit spreads. Since the negotiated spreads were
lower than the then current new issuance spread, a fair value loss
52
Bank of America 2007